Microsoft: Machine Learning for Beginners
【人工智能和机器学习的不同】:
人工智能可以采用多种方法实现,包括基于规则的系统、专家系统、自然语言处理、计算机视觉、机器人等。
机器学习使用统计学和数学算法来分析数据,从数据中发现模式和规律,并建立模型进行预测或决策。
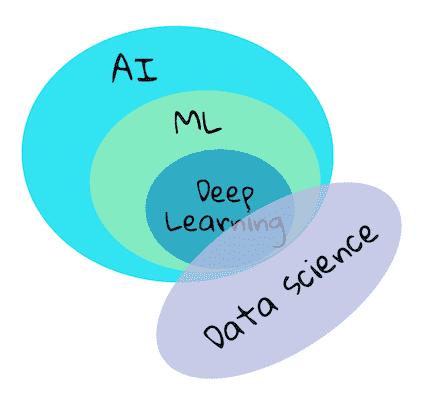
人工智能是一个广泛的概念,指的是机器或计算机模拟、扩展和延伸人类智能的技术和方法。
机器学习是人工智能的一个子领域,它研究如何使计算机从数据中学习并自动改进性能。
人工智能侧重于机器如何模拟和实现人类智能,包括推理、学习、规划、解决问题、感知、运动等。
机器学习侧重于机器如何从数据中学习,自动改进性能,并完成特定的任务。
自动驾驶汽车:
自动驾驶汽车是人工智能的一个重要应用领域。它涉及到感知环境、决策制定和实施行动的复杂任务。
机器学习主要用于处理传感器数据,学习驾驶场景的模式,并作出适当的决策。
智能语音助手:
智能语音助手是人工智能中的一种应用,通过自然语言处理和语音识别技术,使计算机能够理解和执行用户的语音指令。
机器学习被用于训练模型,使得语音助手能够逐渐提高对用户语音的理解能力。
人脸识别系统:
人脸识别系统是人工智能的一部分,它用于识别和验证个体的身份。
机器学习在人脸识别中发挥关键作用,通过训练模型学习人脸特征,从而实现准确的人脸识别。
深度学习是机器学习的一种方法,它使用深度神经网络来模拟和解决复杂问题。深度学习的关键是深层神经网络,这些网络具有多个层次,能够自动学习数据中的特征。深度学习在图像识别、语音识别等领域取得了显著的成就。
生成式 AI 是一种人工智能系统,其目标是生成新的数据,例如图像、音频、文本等。生成式模型可以使用机器学习和深度学习技术,例如生成对抗网络(GAN)等,以创造逼真的新数据,具有创造性和想象力。
深度学习(Deep Learning)和生成式人工智能(Generative AI)的不同:
是人工智能领域中的两个相关但不同的概念:

深度学习:
    深度学习是一种机器学习方法,其核心是使用深度神经网络来模拟和解决复杂问题。
    这种方法的特点是神经网络具有多个深层次的层次结构,这样可以自动学习数据中的特征。
    深度学习在图像识别、语音识别、自然语言处理等任务中取得了显著的成就。
    常见的深度学习模型包括卷积神经网络(CNN)和循环神经网络(RNN)等。

生成式人工智能:
    生成式人工智能是一种人工智能系统,其目标是生成新的数据,而不仅仅是对已有数据进行分类或预测。
    这种方法涉及到模型生成新的、先前未见的数据,具有创造性和想象力。
    生成式人工智能通常使用生成对抗网络(GAN)、变分自编码器(VAE)等技术。
    应用包括图像生成、音乐创作、文本生成等领域。

深度学习强调通过深层次的神经网络学习数据的表示,解决复杂任务
生成式AI注重于创造新的数据,具有一定的创造性和生成能力
1. Introduction
1. Introduction to machine learning
本课程中学到什么:
机器学习的核心概念
机器学习的历史
机器学习和公平性
回归
分类
聚类
自然语言处理
时序预测
强化学习
机器学习的实际应用
不会涵盖的内容:
深度学习
神经网络
AI
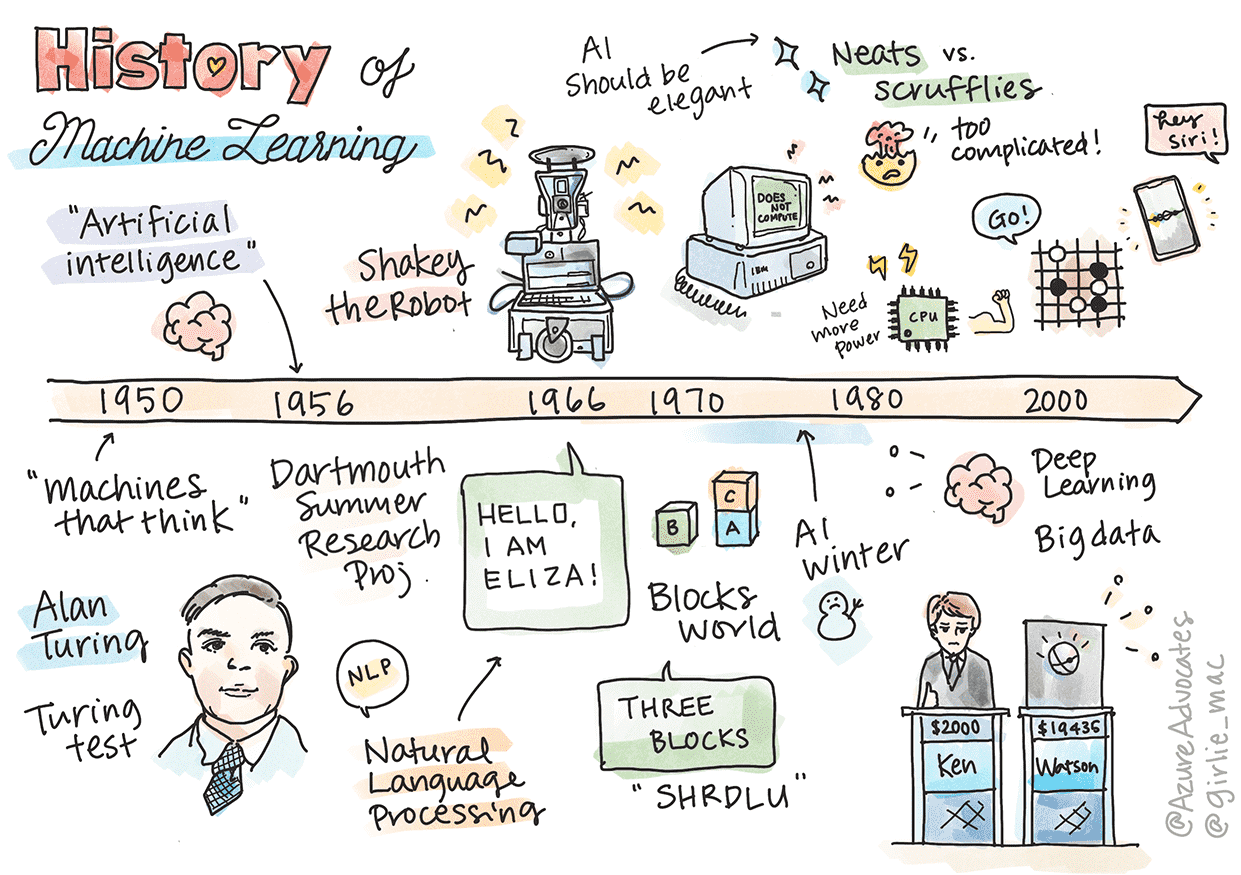
2. History of machine learning
Notable discoveries:
1763, 1812 贝叶斯定理 及其前身。该定理及其应用是推理的基础,描述了基于先验知识的事件发生的概率。
1805 最小二乘理论由法国数学家 Adrien-Marie Legendre 提出。 它有助于数据拟合。
1913 马尔可夫链以俄罗斯数学家 Andrey Markov 的名字命名,用于描述基于先前状态的一系列可能事件。
1957 感知器是美国心理学家 Frank Rosenblatt 发明的一种线性分类器,是深度学习发展的基础。
1967 最近邻是一种最初设计用于映射路线的算法。 在 ML 中,它用于检测模式。
1970 反向传播用于训练前馈神经网络。
1982 循环神经网络 是源自产生时间图的前馈神经网络的人工神经网络。

1763, 1812 Bayes Theorem and its predecessors.
1805 Least Square Theory by French mathematician Adrien-Marie Legendre.
1913 Markov Chains, named after Russian mathematician Andrey Markov
1957 Perceptron is a type of linear classifier invented by American psychologist
1967 Nearest Neighbor is an algorithm originally designed to map routes.
1970 Backpropagation is used to train feedforward neural networks.
1982 Recurrent Neural Networks are artificial neural networks derived from feedforward neural networks that create temporal graphs.
1950: 会思考的机器。Alan Turing 通过创建 图灵测试来解决反对者和他自己对这一概念的经验证据的需求 1956: 达特茅斯夏季研究项目。创造了“人工智能”一词。原则上,学习的每个方面或智能的任何其他特征都可以被精确地描述,以至于可以用机器来模拟它。 1956 - 1974: “黄金岁月”:机器人 Shakey、早期的“聊天机器人”Eliza、积木世界 1974 - 1980: AI 的寒冬。影响信心的一些问题包括:计算能力限制、数据组合爆炸、缺乏数据、中文房间(Chinese room) 1980s 专家系统: “专家系统是首批真正成功的人工智能 (AI) 软件形式之一。” 1987 - 1993: AI 的冷静期
3. Building ML solutions with responsible AI
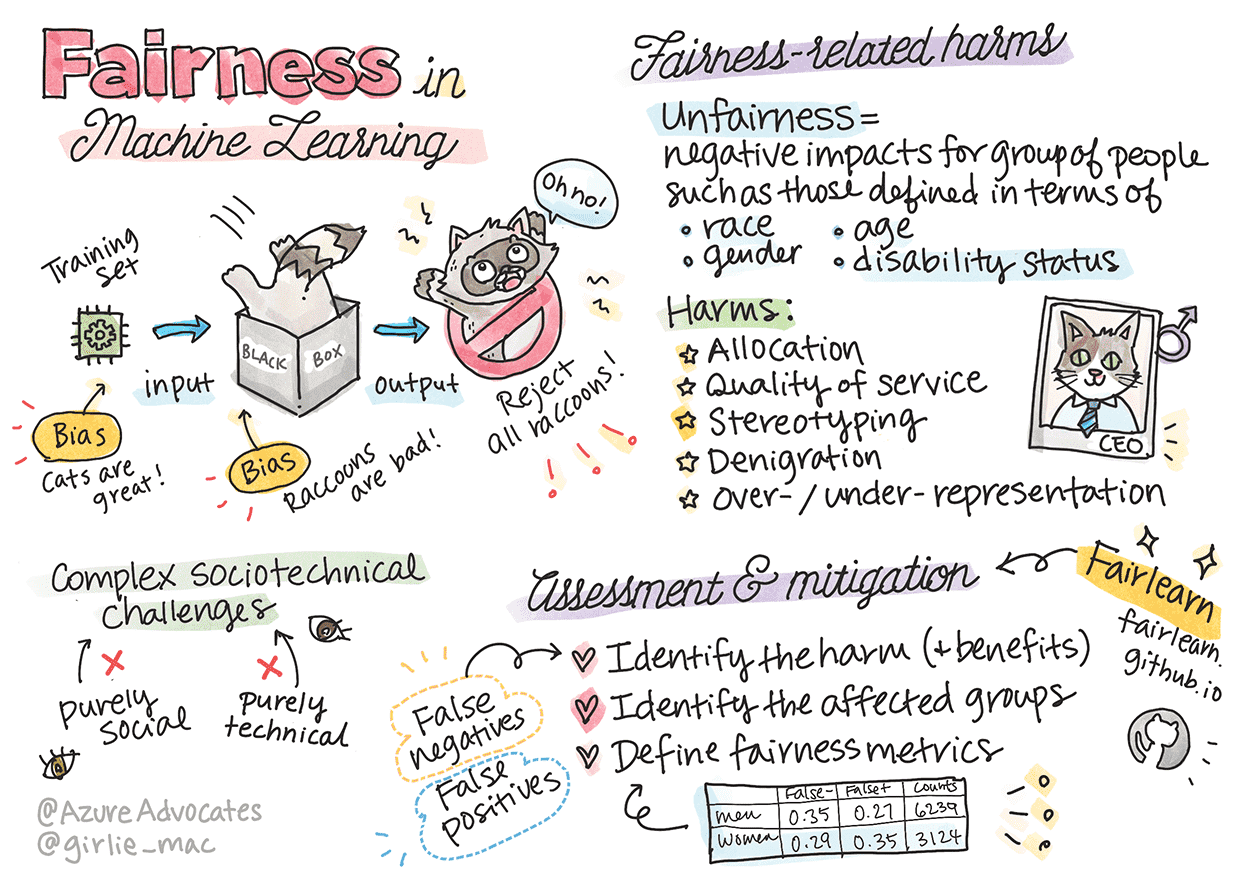
与公平相关的危害:
分配,比如一个性别或种族比另一个更受青睐。
服务质量。 如果你针对一种特定场景训练数据,但实际情况要复杂得多。
刻板印象(成见)。将给定的组与预先分配的属性相关联。如:中文的他(她)识别问题
诋毁。 不公平地批评和标记某事或某人。如:把黑人标识为大猩猩
代表性过高或过低。这种想法是,某个群体在某个行业中不被看到,而这个行业一直在提升,这是造成伤害的原因。

Allocation, if a gender or ethnicity is favored over another.
Quality of service. If you train the data for one specific scenario but reality is much more complex
Stereotyping. Associating a given group with pre-assigned attributes
Denigration. To unfairly criticize and label something or someone.
Over- or under- representation. The idea is that a certain group is not seen in a certain profession, and any service or function that keeps promoting that is contributing to harm.
4. Techniques of Machine Learning
ML processes is comprised of a number of steps:
1. Decide on the question.
2. Collect and prepare data.
3. Choose a training method.
4. Train the model.
5. Evaluate the model.
6. Parameter tuning.
7. Predict.
2. Regression
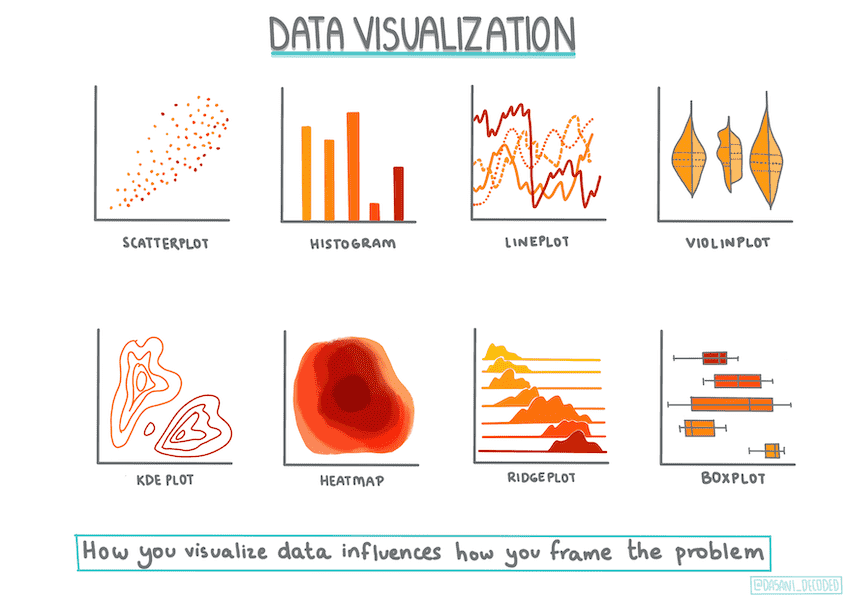
1. Tools of the trade
本章主要讲如何使用工具:
1. 环境
2. Jupyter notebooks
3. Scikit-learn
2. Managing data
备注
具体详情参见demo_python项目的demo_pumpkin
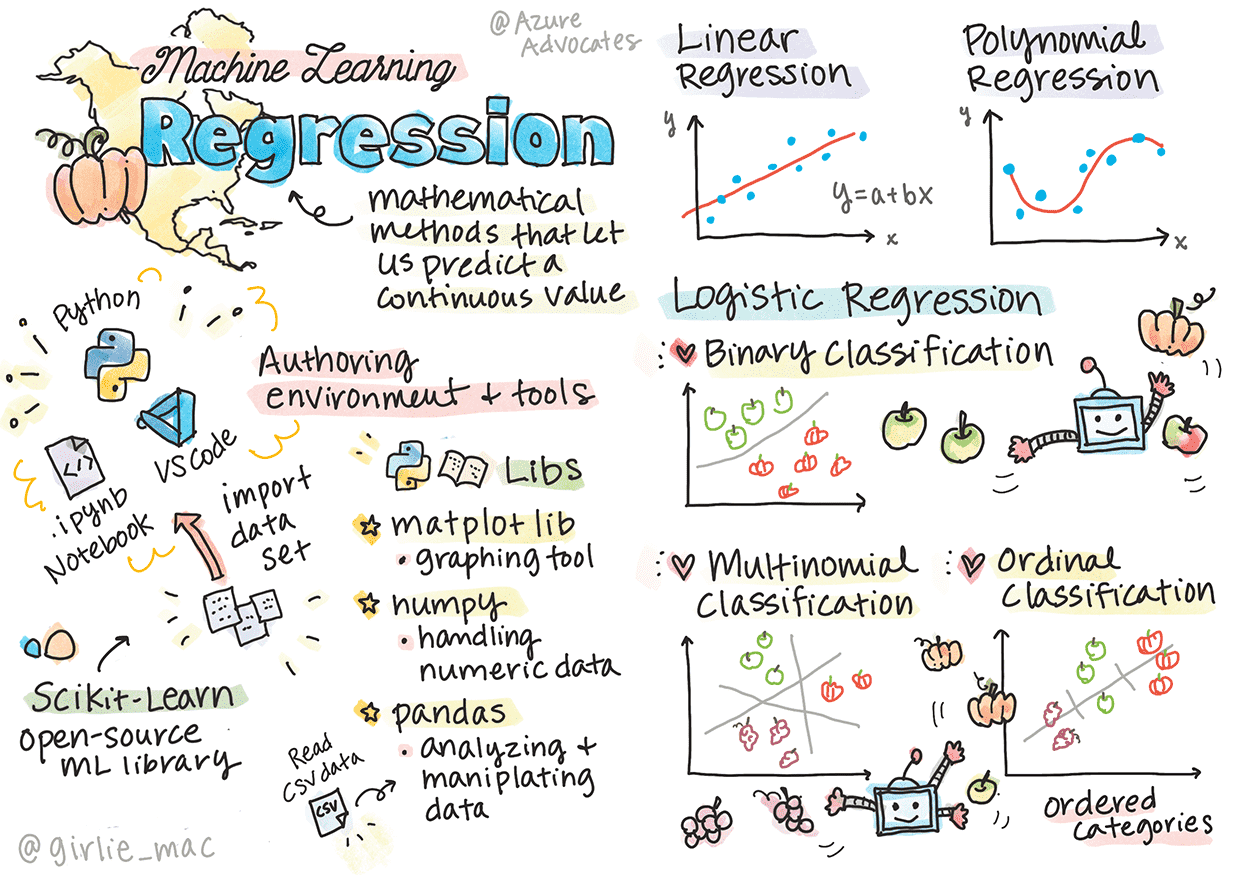
3. Linear and polynomial regression
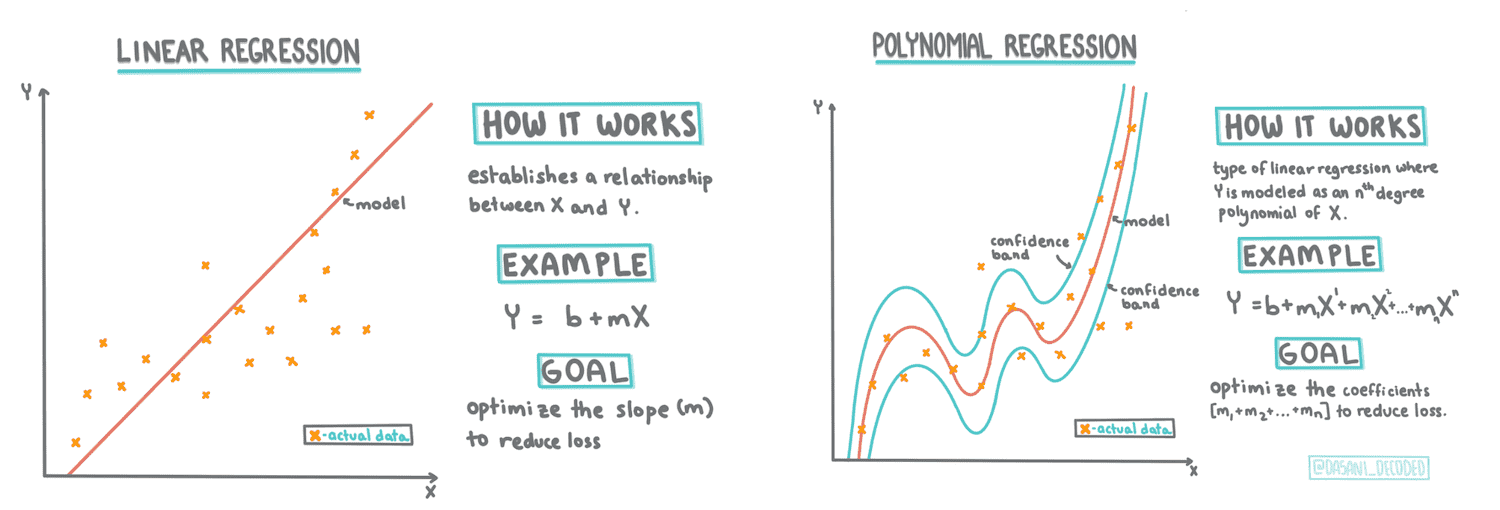
备注
使用 Scikit-learn 构建回归模型的两种方式的回归即:线性回归和多项式回归。具体详情参见demo_python项目的demo_pumpkin
A good course to study to learn more: Statistical Learning: https://online.stanford.edu/courses/sohs-ystatslearning-statistical-learning
4. Logistic regression
备注
具体详情参见demo_python项目的demo_pumpkin
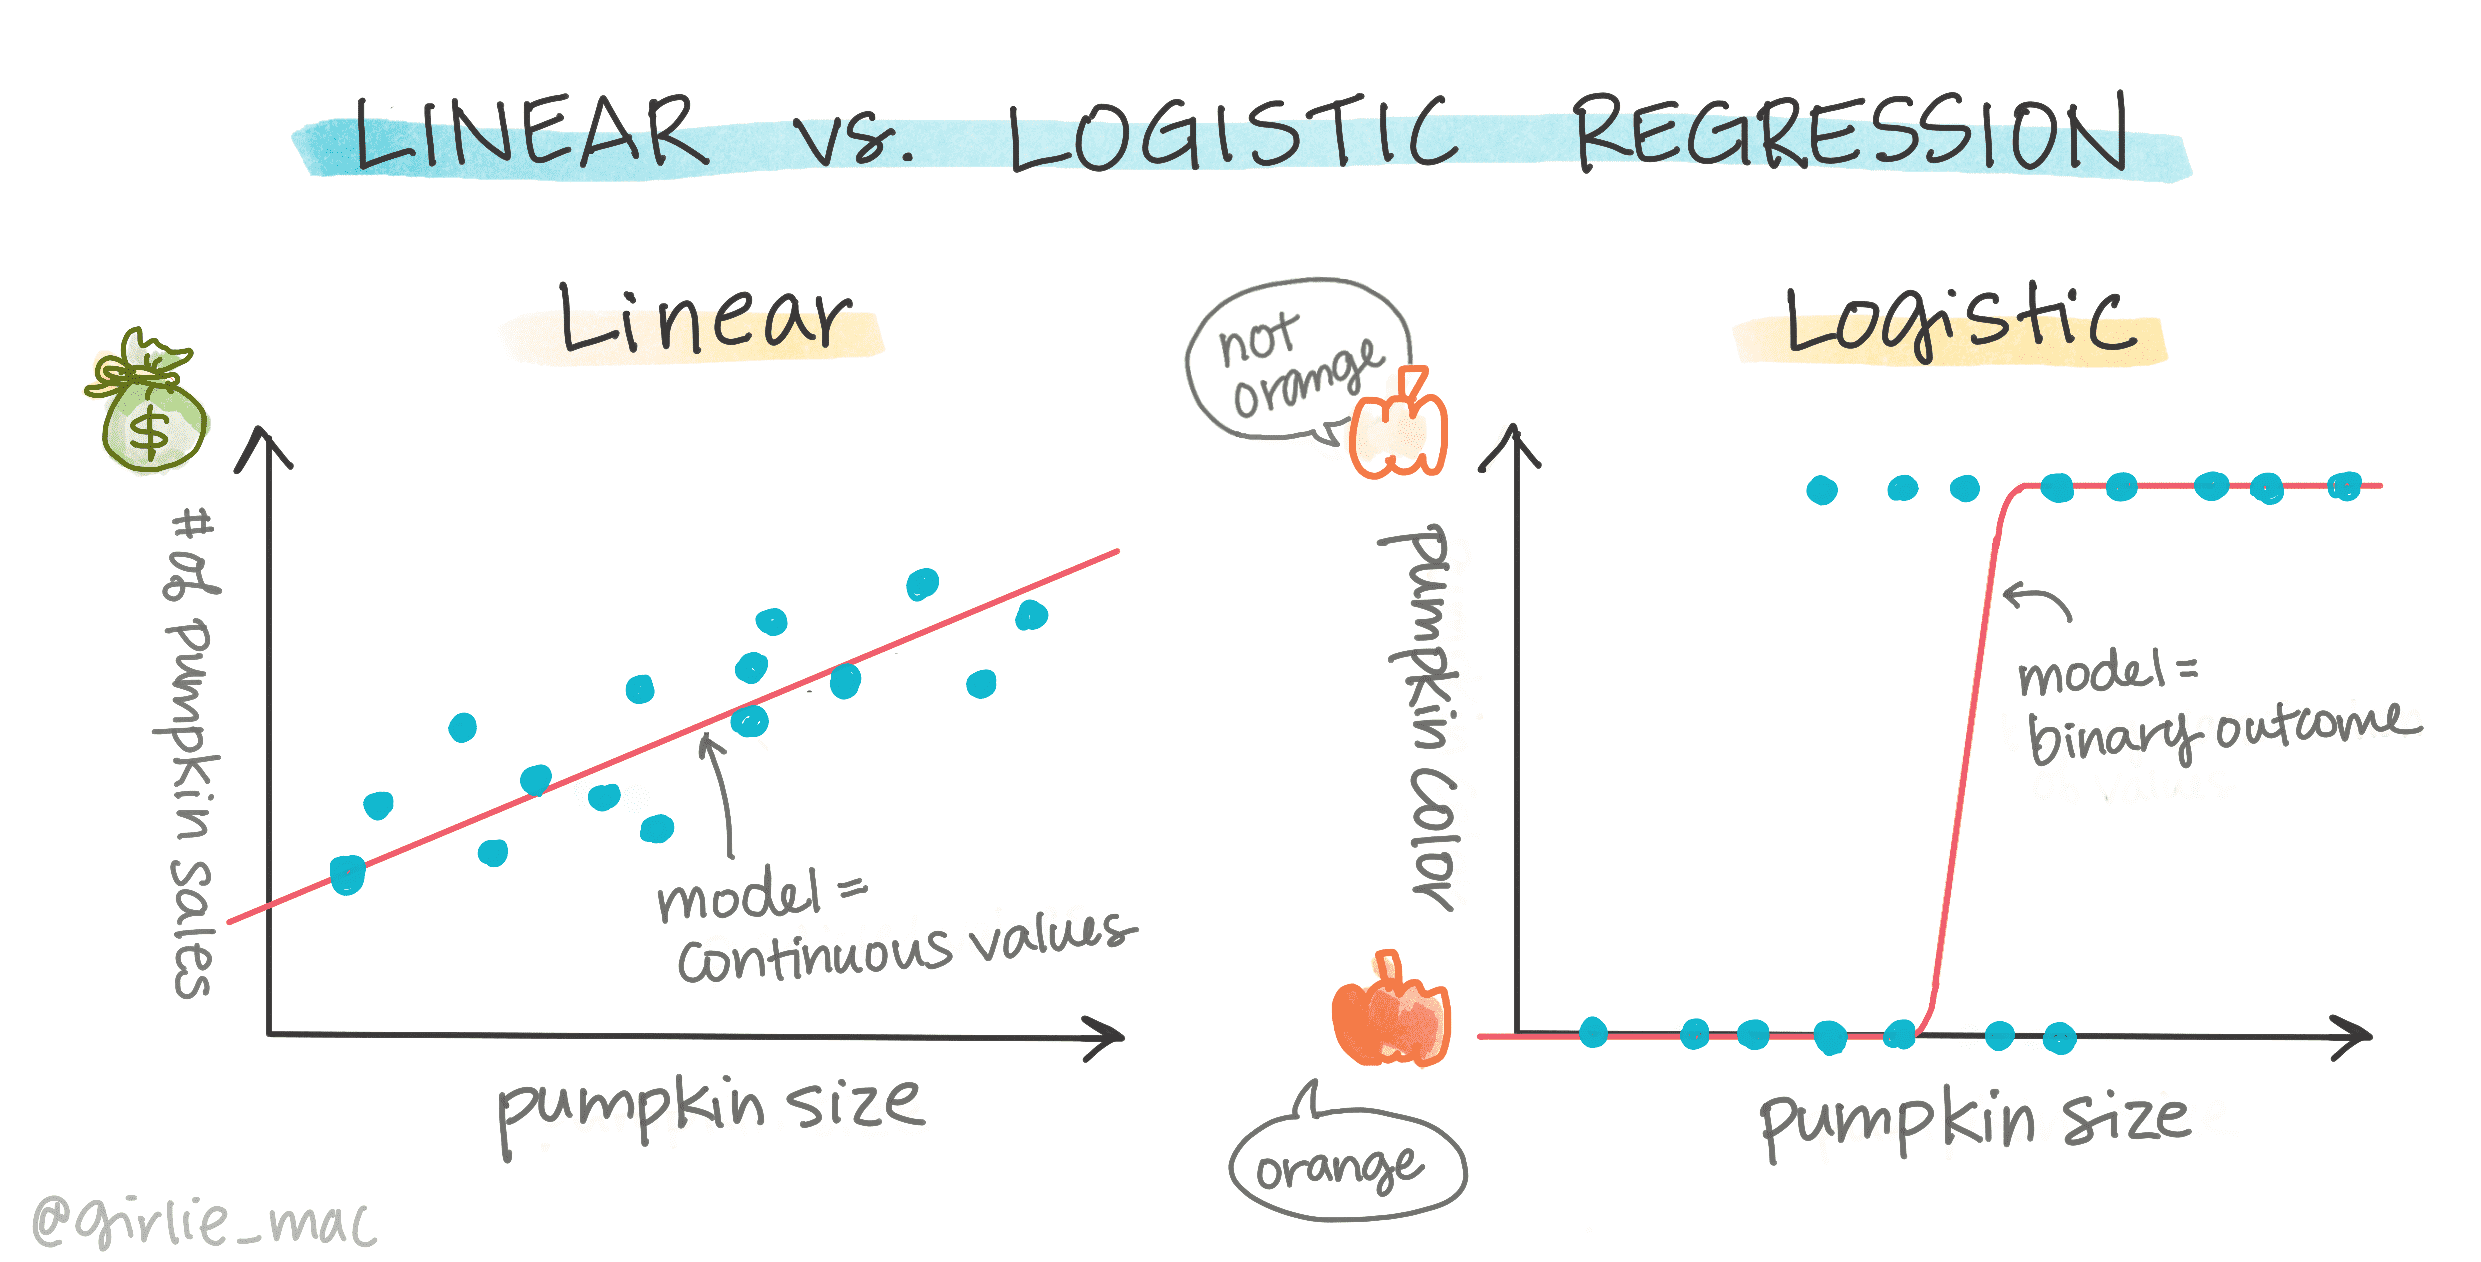
二元分类
逻辑回归提供关于二元类别(“橙色或非橙色”)的预测
其他分类-多项和有序
多项,涉及多个类别 - “橙色、白色和条纹”
有序,涉及有序类别,如南瓜按大小(mini、sm、med、lg、xl、xxl)排序
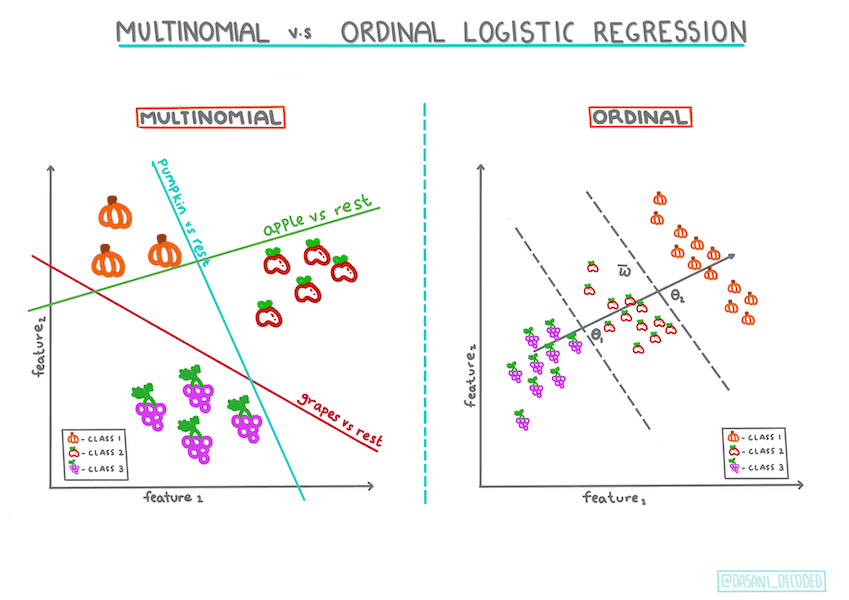
需要大量干净的数据。如果使用更多数据,逻辑回归将给出更准确的结果
3. Web-App
Build a Web App to use a ML Model
4. Classification
1. Introduction
分类算法是监督学习的一种。它与回归算法在很多方面都有相同之处。
分类算法通常可以分为两类 二元分类 和 多元分类。
线性回归: 帮助你预测变量之间的关系并对一个新的数据点会落在哪条线上做出精确的预测。因此,你可以预测 南瓜在九月的价格和十月的价格。
逻辑回归: 帮助你发现“二元范畴”:即在当前这个价格, 这个南瓜是不是橙色?
2. Classifiers-1
备注
具体详情参见demo_python项目下demo_cuisines
用于分类的算法:
1. 线性模型(Linear Models)
2. 支持向量机(Support Vector Machines)
3. 随机梯度下降(Stochastic Gradient Descent)
4. 最近邻(Nearest Neighbors)
5. 高斯过程(Gaussian Processes)
6. 决策树(Decision Trees)
7. 集成方法(投票分类器)(Ensemble methods(voting classifier))
8. 多类别多输出算法(多类别多标签分类,多类别多输出分类)
    (Multiclass and multioutput algorithms (multiclass and multilabel classification, multiclass-multioutput classification))
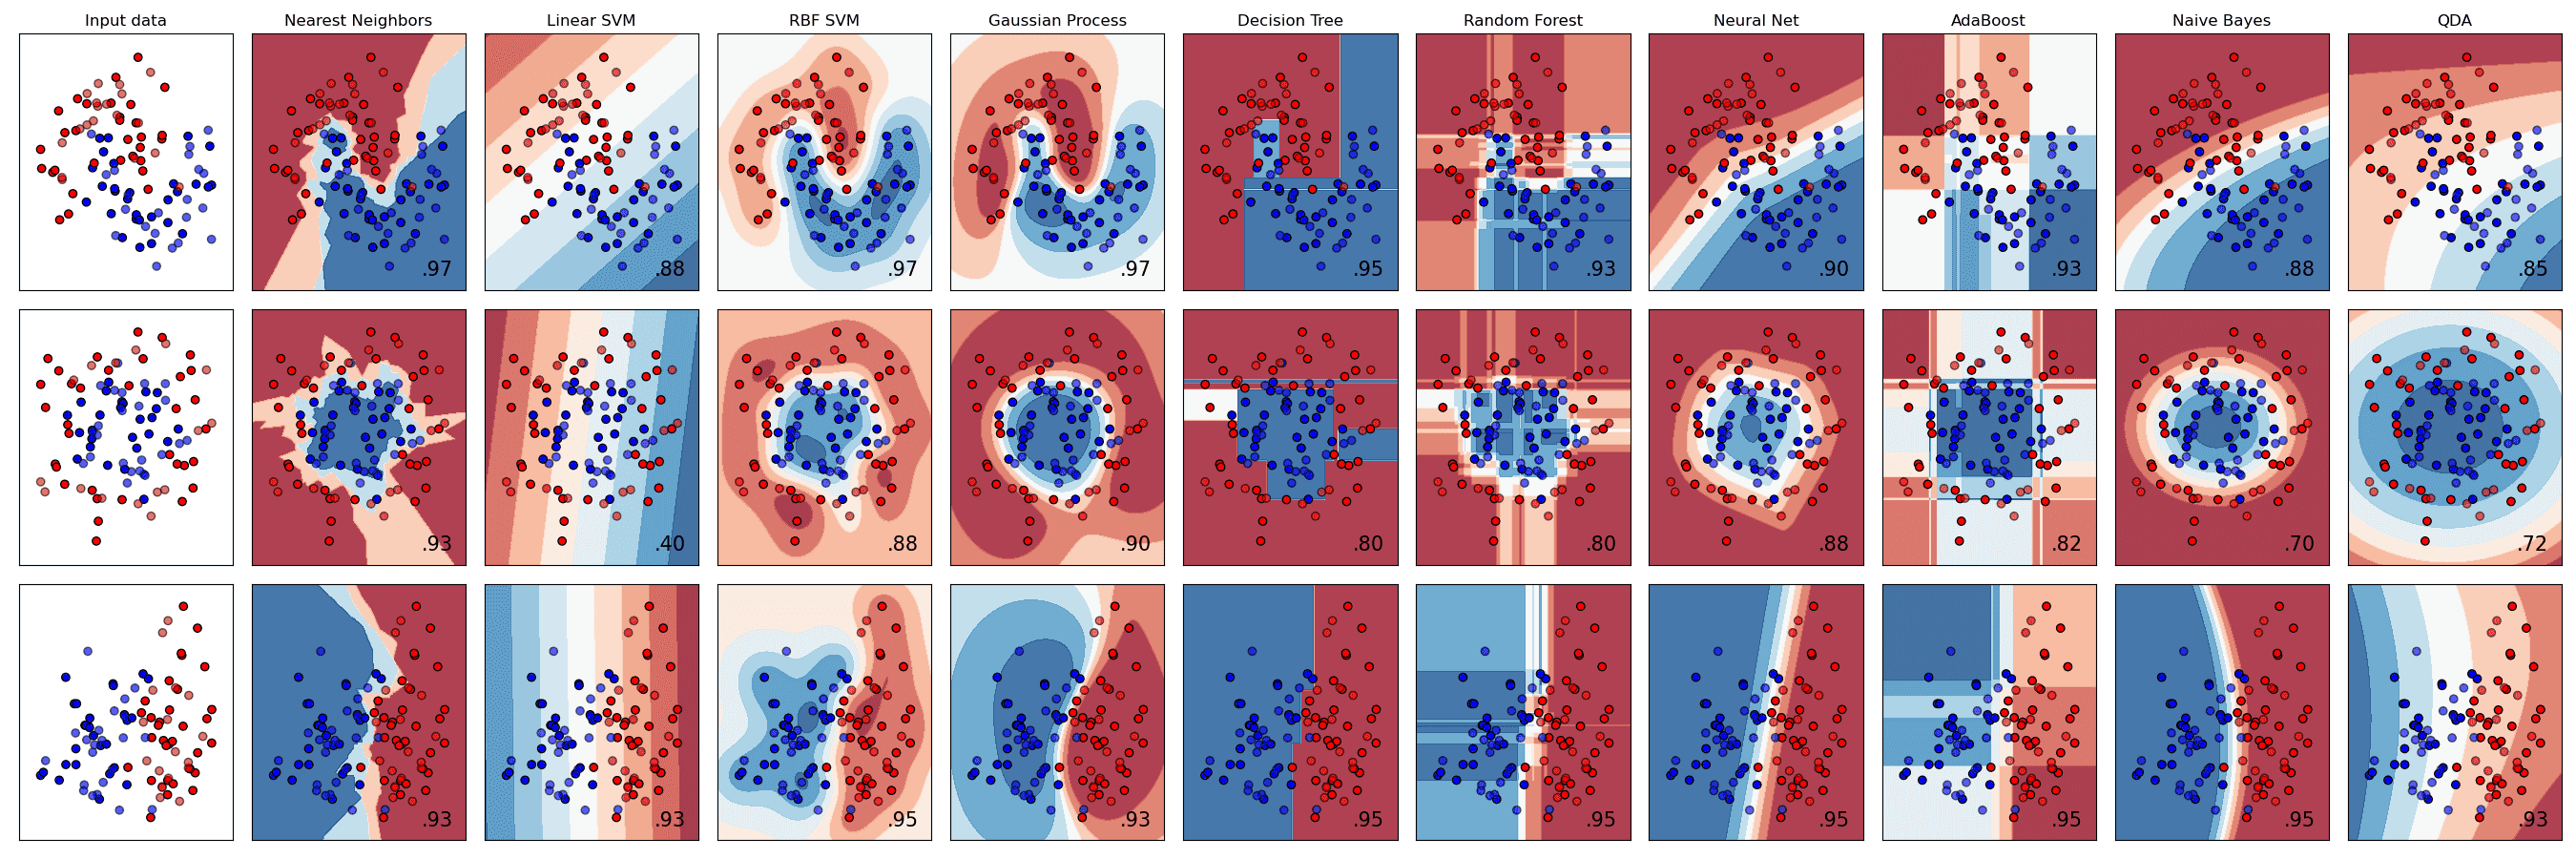
Scikit-learn 提供了各种算法(包括 KNeighbors、 SVC two ways、 GaussianProcessClassifier、 DecisionTreeClassifier、 RandomForestClassifier、 MLPClassifier、 AdaBoostClassifier、 GaussianNB 以及 QuadraticDiscrinationAnalysis)的对比
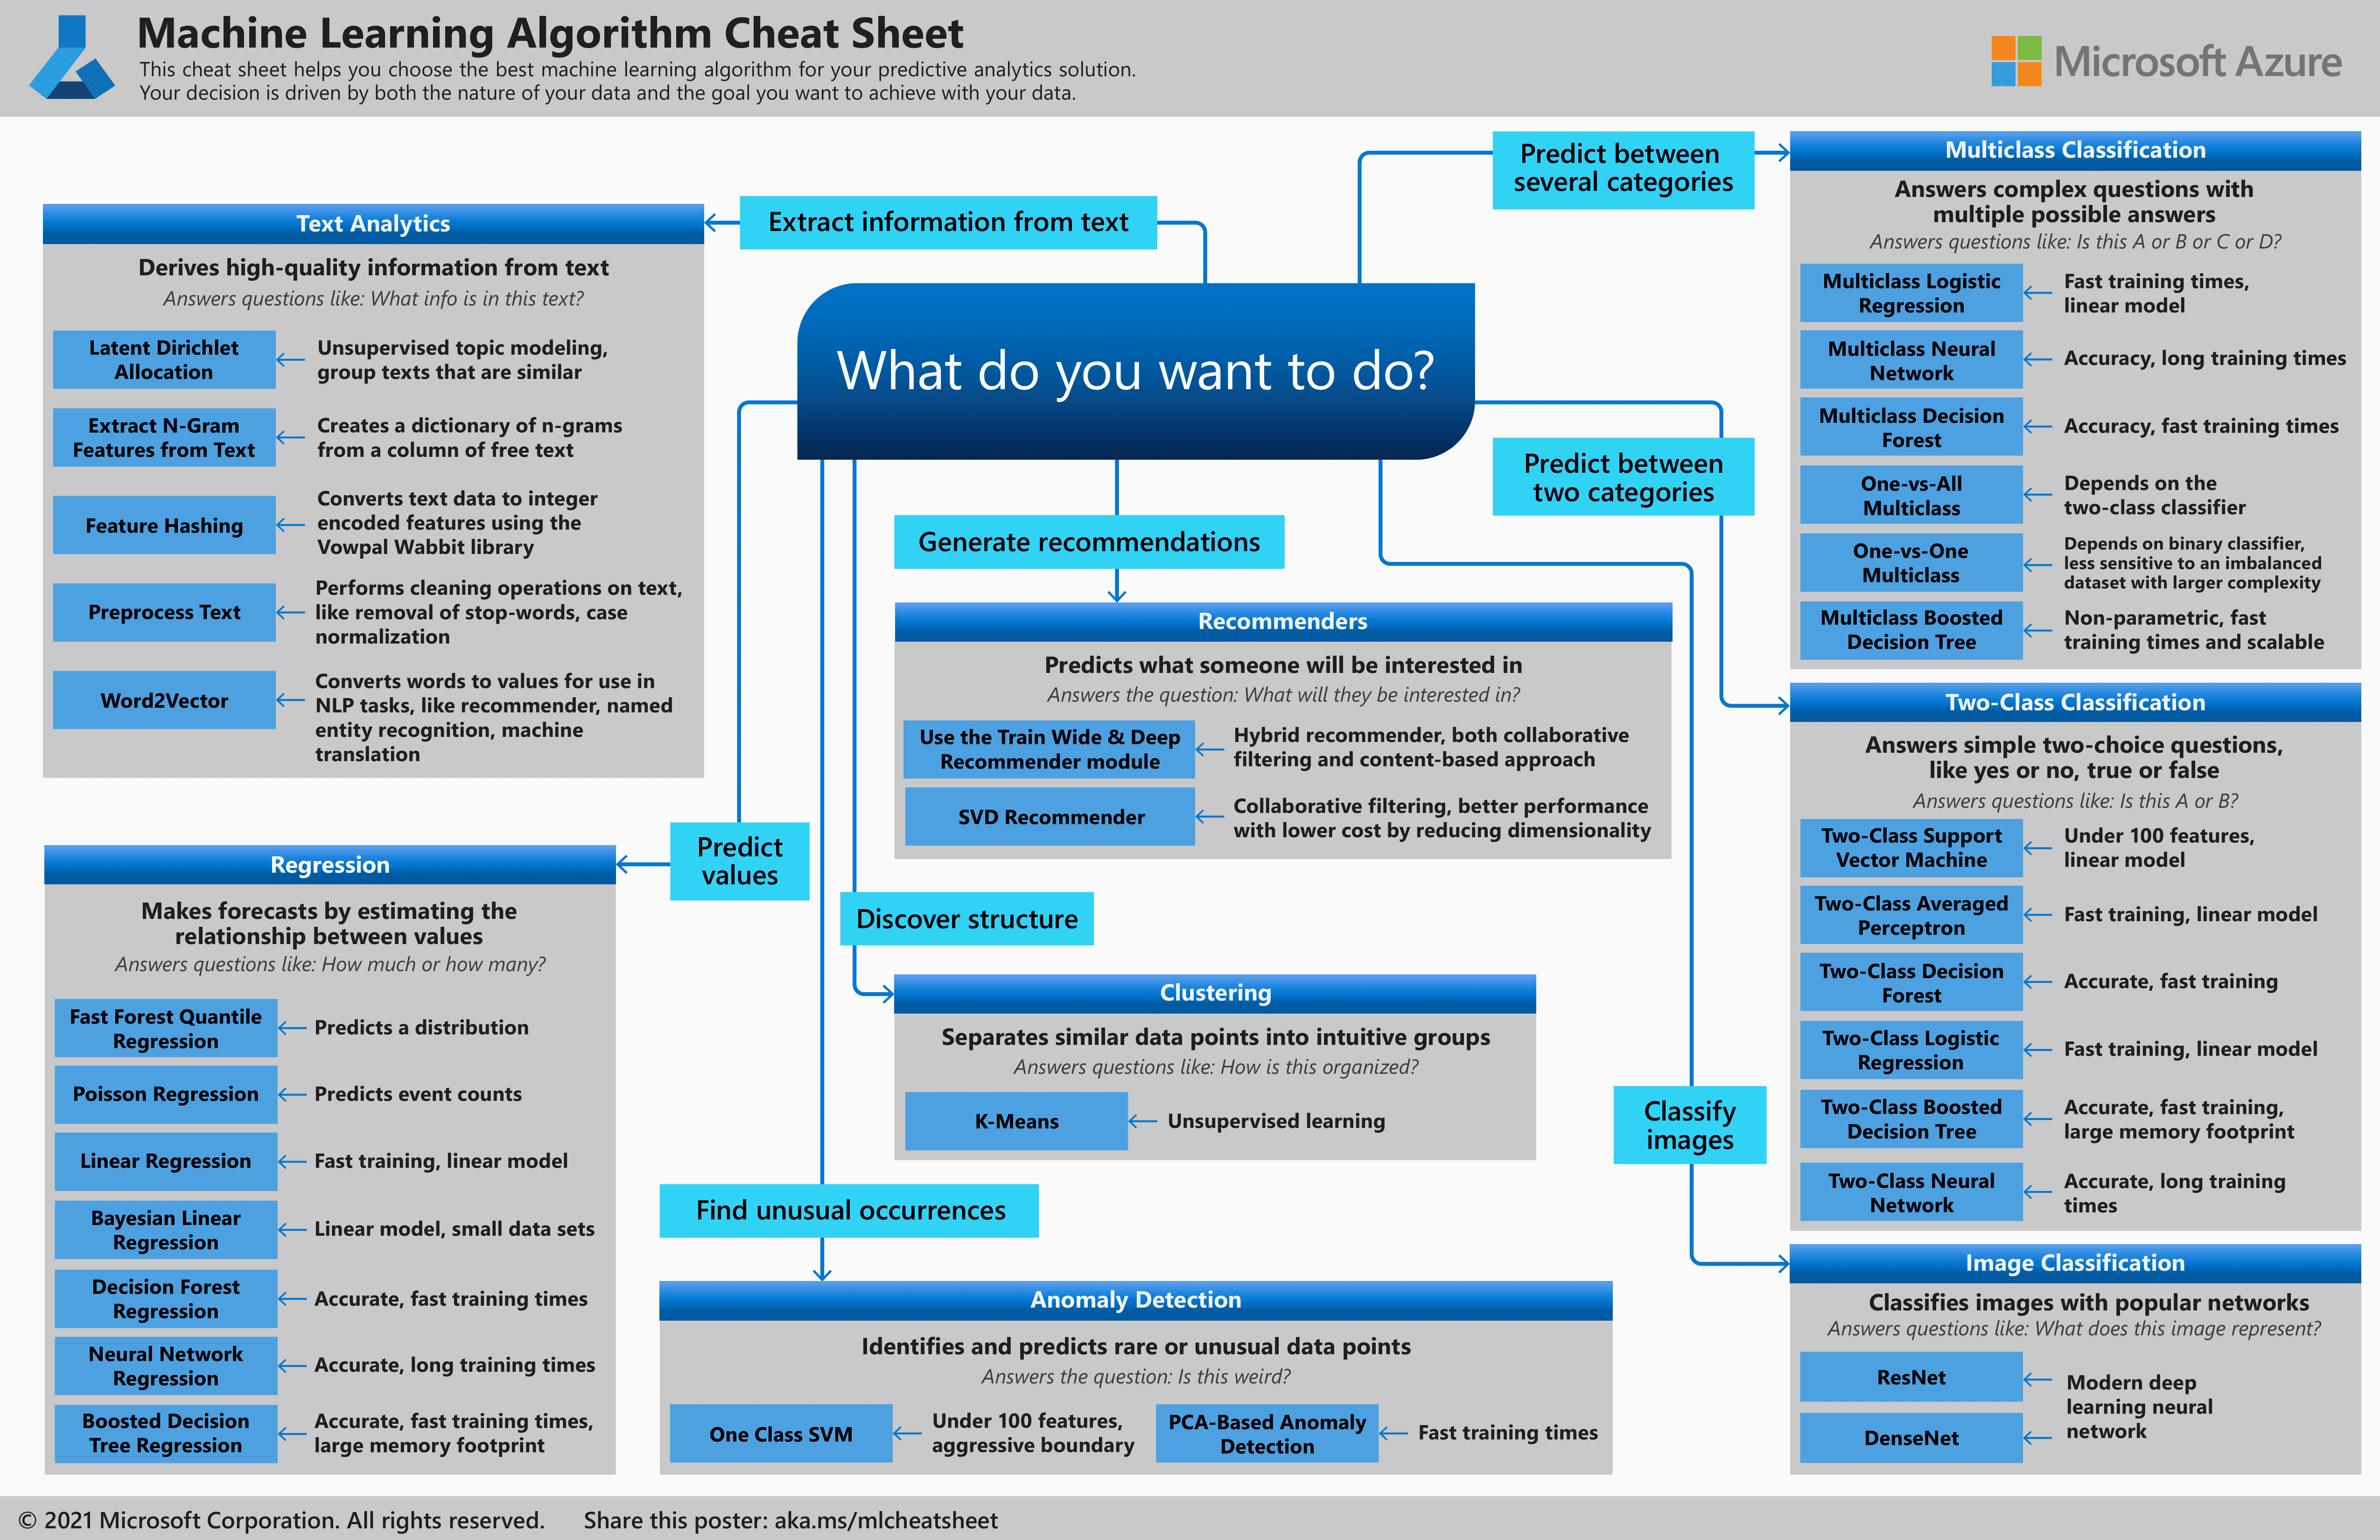
机器学习速查表(cheatsheet)。这里面将各算法进行了比较,能更有效地帮助我们选择算法。
3. Classifiers-2
备注
具体详情参见demo_python项目下demo_cuisines
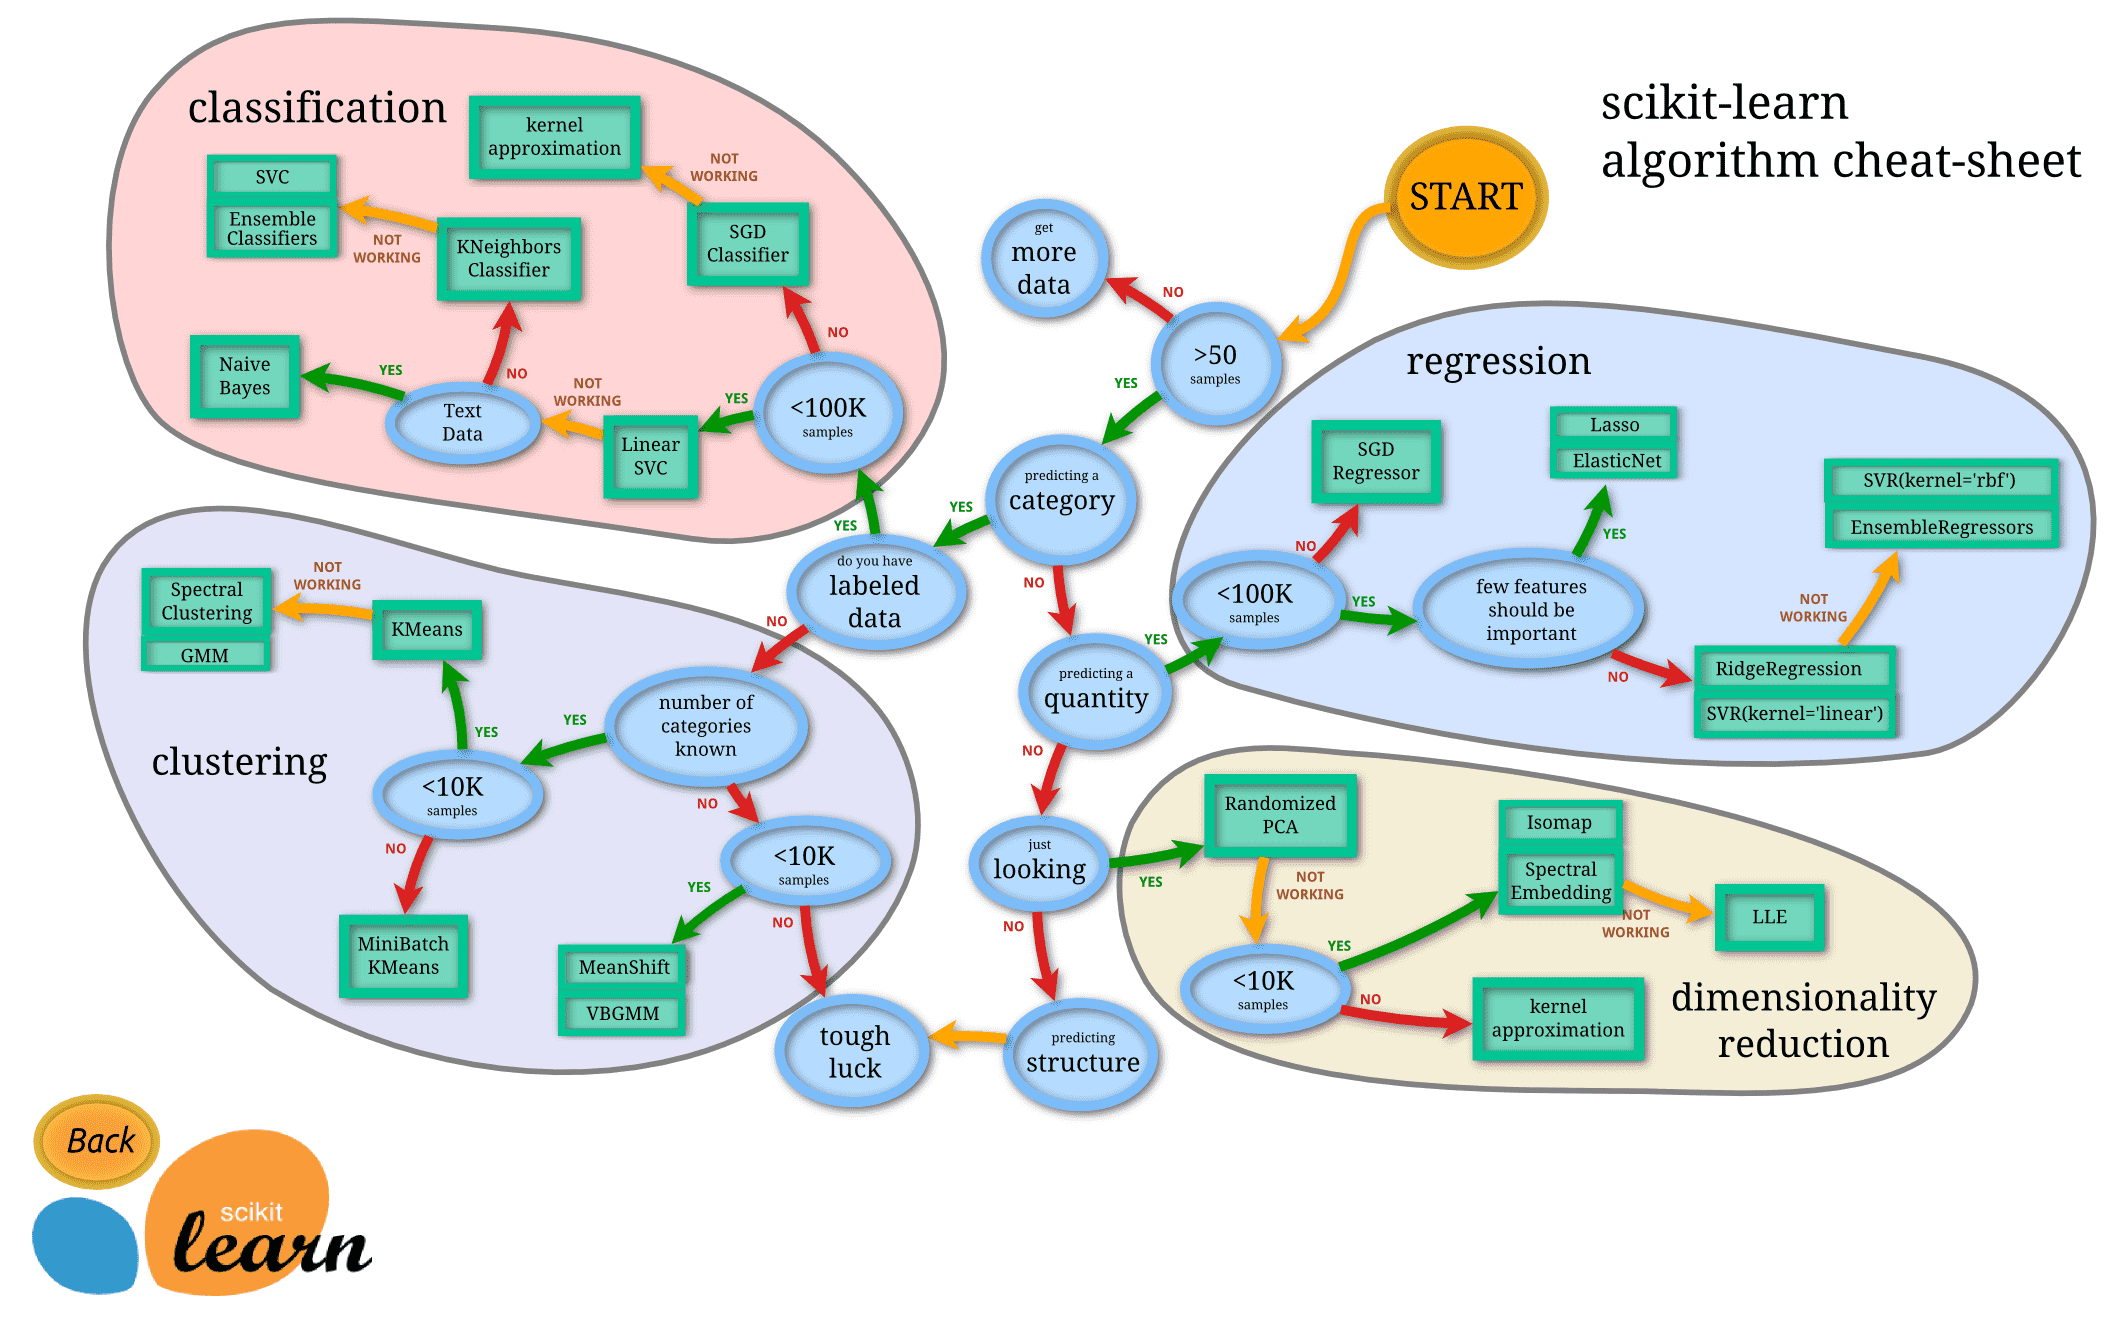
分类学习路线图: https://scikit-learn.org/stable/tutorial/machine_learning_map/
4. Applied
备注
具体详情参见demo_python项目下demo_cuisines
学习:
如何构建模型并将它保存为 Onnx 模型
如何使用 Netron 去检查模型
如何在 Web 应用程序中使用您的模型去进行推理
5. Clustering
聚类(clustering)是一项机器学习任务,用于寻找类似对象并将他们分成不同的组(这些组称做“聚类”(cluster))。聚类与其它机器学习方法的不同之处在于聚类是自动进行的。事实上,我们可以说它是监督学习的对立面。
1. Introduction to clustering
备注
具体详情参见demo_python项目下demo_nigerian-songs
Getting started with clustering
Scikit-learn 支持的聚类方法:
00. K-Means:                        general purpose, inductive
01. Affinity propagation            many, uneven clusters, inductive
02. Mean-shift                      many, uneven clusters, inductive
03. Spectral clustering             few, even clusters, transductive
04. Ward hierarchical clustering    many, constrained clusters, transductive
05. Agglomerative clustering        many, constrained, non Euclidean distances, transductive
06. DBSCAN                          non-flat geometry, uneven clusters, transductive
07. OPTICS                          non-flat geometry, uneven clusters with variable density, transductive
08. Gaussian mixtures               flat geometry, inductive
09. BIRCH                           large dataset with outliers, inductive
关键词:
inductive: 归纳的
transductive: 直推式的
    transductive learning: 直推学习;直推式学习;转导学习;半监督学习和直推学习
    transductive reasoning: 转换推理
    Transductive Inference: 转导推理
    Transductive Transfer Learning: 迁移学习
    Transductive SVM: 直推式支持向量机
    transductive HMM: 增益的隐马尔科夫模型
uneven: 不均匀的
outlier: 异常值
density: 密度
‘transductive’ vs. ‘inductive’:
Transductive inference is derived from observed training cases that map to specific test cases.
Inductive inference is derived from training cases that map to general rules which are only then applied to test cases.

归纳法的优点:
  通用性:如果训练得当,归纳模型可以应用于初始数据集之外的数据,使其对未来的预测任务有用。
  可解释性:归纳模型通常可以更清晰地了解用于分类的特征或模式,可能有助于理解数据。
传导方法的优点:
  更好地处理未知数据:正如您所提到的,传导方法可以更有效地对不完全符合预定义类别的数据进行分类
  利用未标记的数据:传导方法可以利用来自未标记数据点的信息,从而可能提高标记和未标记数据的标记准确性。

挑战:
  归纳法:训练数据的过度拟合或欠拟合可能会导致在未见过的数据上表现不佳。此外,为模型定义适当的特征也至关重要。
  传导法:性能可能高度依赖于特定的数据集和任务,并且可能无法很好地推广到其他应用程序。为聚类选择正确的相似性度量也很重要。

需要考虑的权衡:
  特定数据的普遍性与准确性:目标是对当前数据集进行准确预测,那么传导方法可能会更好。目标是应用于未来新数据的模型,归纳方法更可取。
  可解释性与灵活性:归纳模型提供了更多的可解释性,但转导方法在处理不同的数据时可能更灵活。
‘Non-flat’ vs. ‘flat’ geometry:
Derived from mathematical terminology
    flat geometry refers to the measure of distances between points by 'flat' (Euclidean) geometrical methods.
    non-flat geometry refers to the measure of distances between points by 'non-flat' (non-Euclidean) geometrical methods.
源自数学术语
    平坦几何是指通过 “平坦”(欧几里得)几何方法来测量点之间的距离
    非平坦几何是指通过 “非平坦”(非欧几里得)几何方法来测量点之间的距离
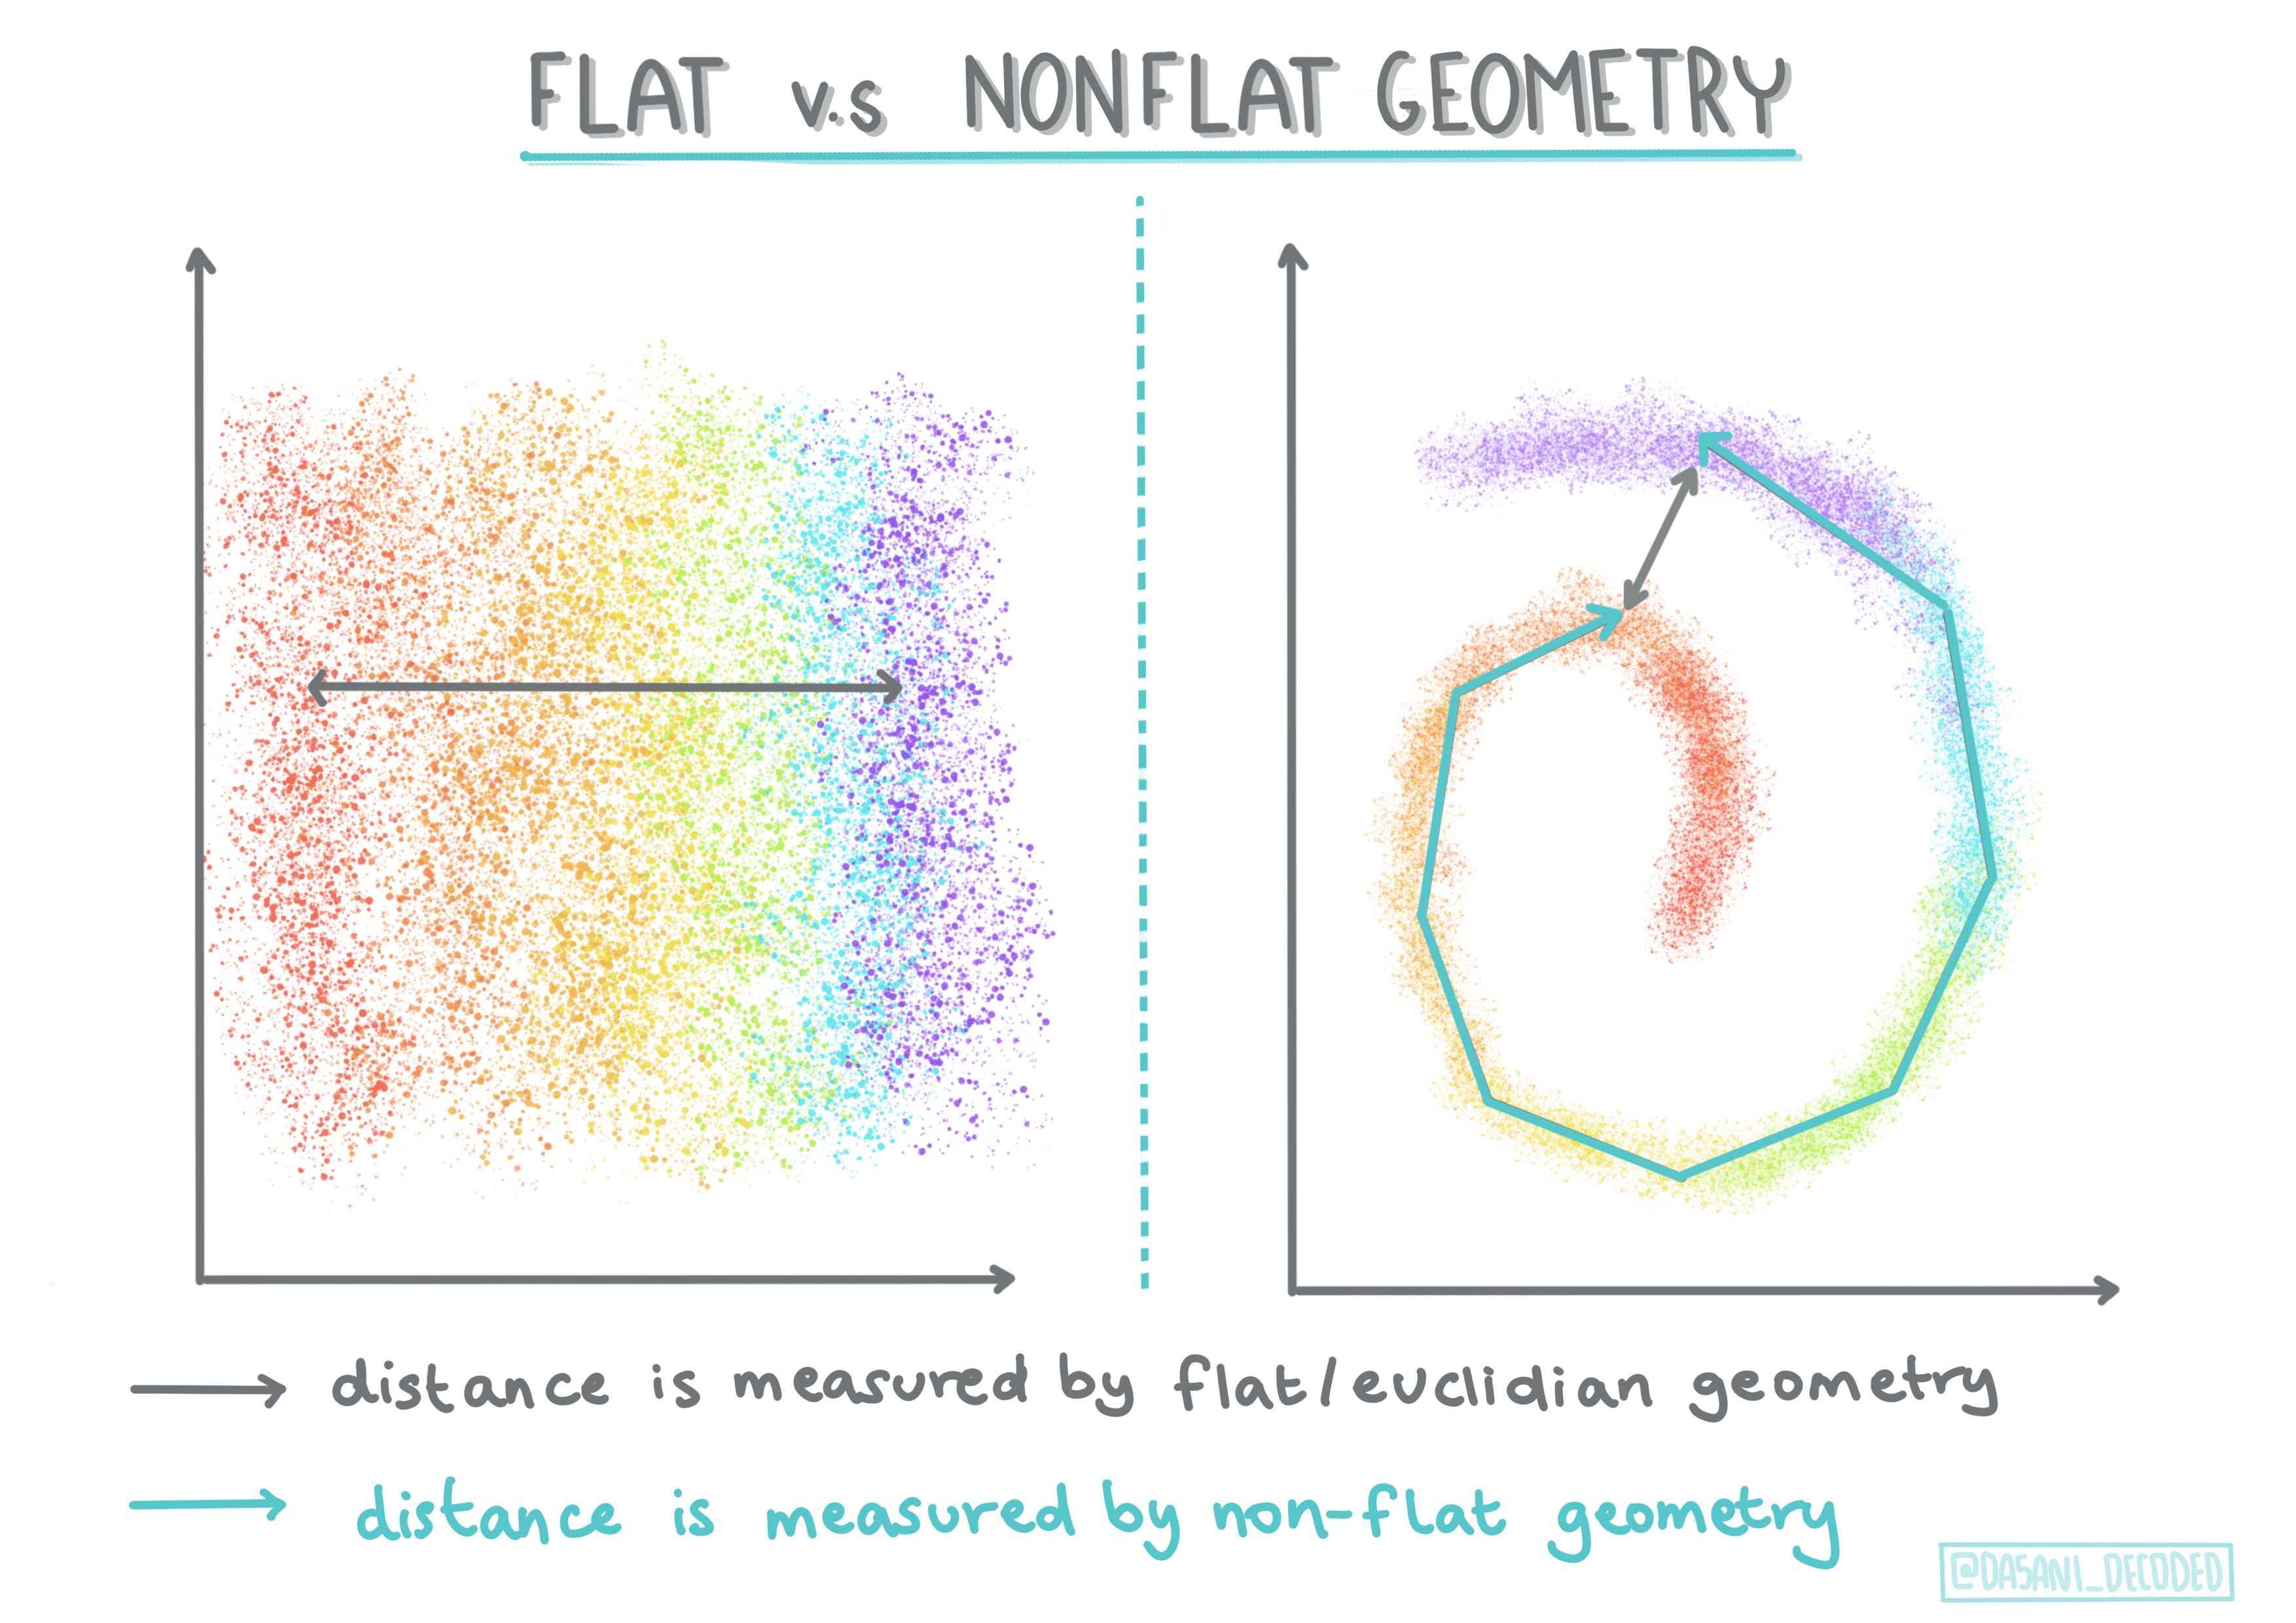
Euclidean distances are measured as the length of a line segment between two points. Non-Euclidean distances are measured along a curve.
约束聚类(Constrained Clustering)将 “半监督” 学习引入到这种无监督方法中。点之间的关系被标记为 “无法链接” 或 “必须链接”,因此在数据集上强制执行一些规则。举个例子:如果一个算法在一批未标记或半标记的数据上自由发挥,它产生的簇可能质量很差。在上面的示例中,集群可能会将 “圆形音乐事物” 和 “方形音乐事物” 以及 “三角形事物” 和 “饼干” 分组。如果给出一些约束或遵循的规则(“该物品必须由塑料制成”,“该物品需要能够产生音乐”),这可以帮助 “约束” 算法做出更好的选择。
Data that is ‘noisy’ is considered to be ‘dense’. The distances between points in each of its clusters may prove, on examination, to be more or less dense, or ‘crowded’ and thus this data needs to be analyzed with the appropriate clustering method. “嘈杂”的数据被认为是“密集”的。经过检查,每个簇中的点之间的距离可能会或多或少密集或“拥挤”,因此需要使用适当的聚类方法来分析该数据。
Clustering algorithms
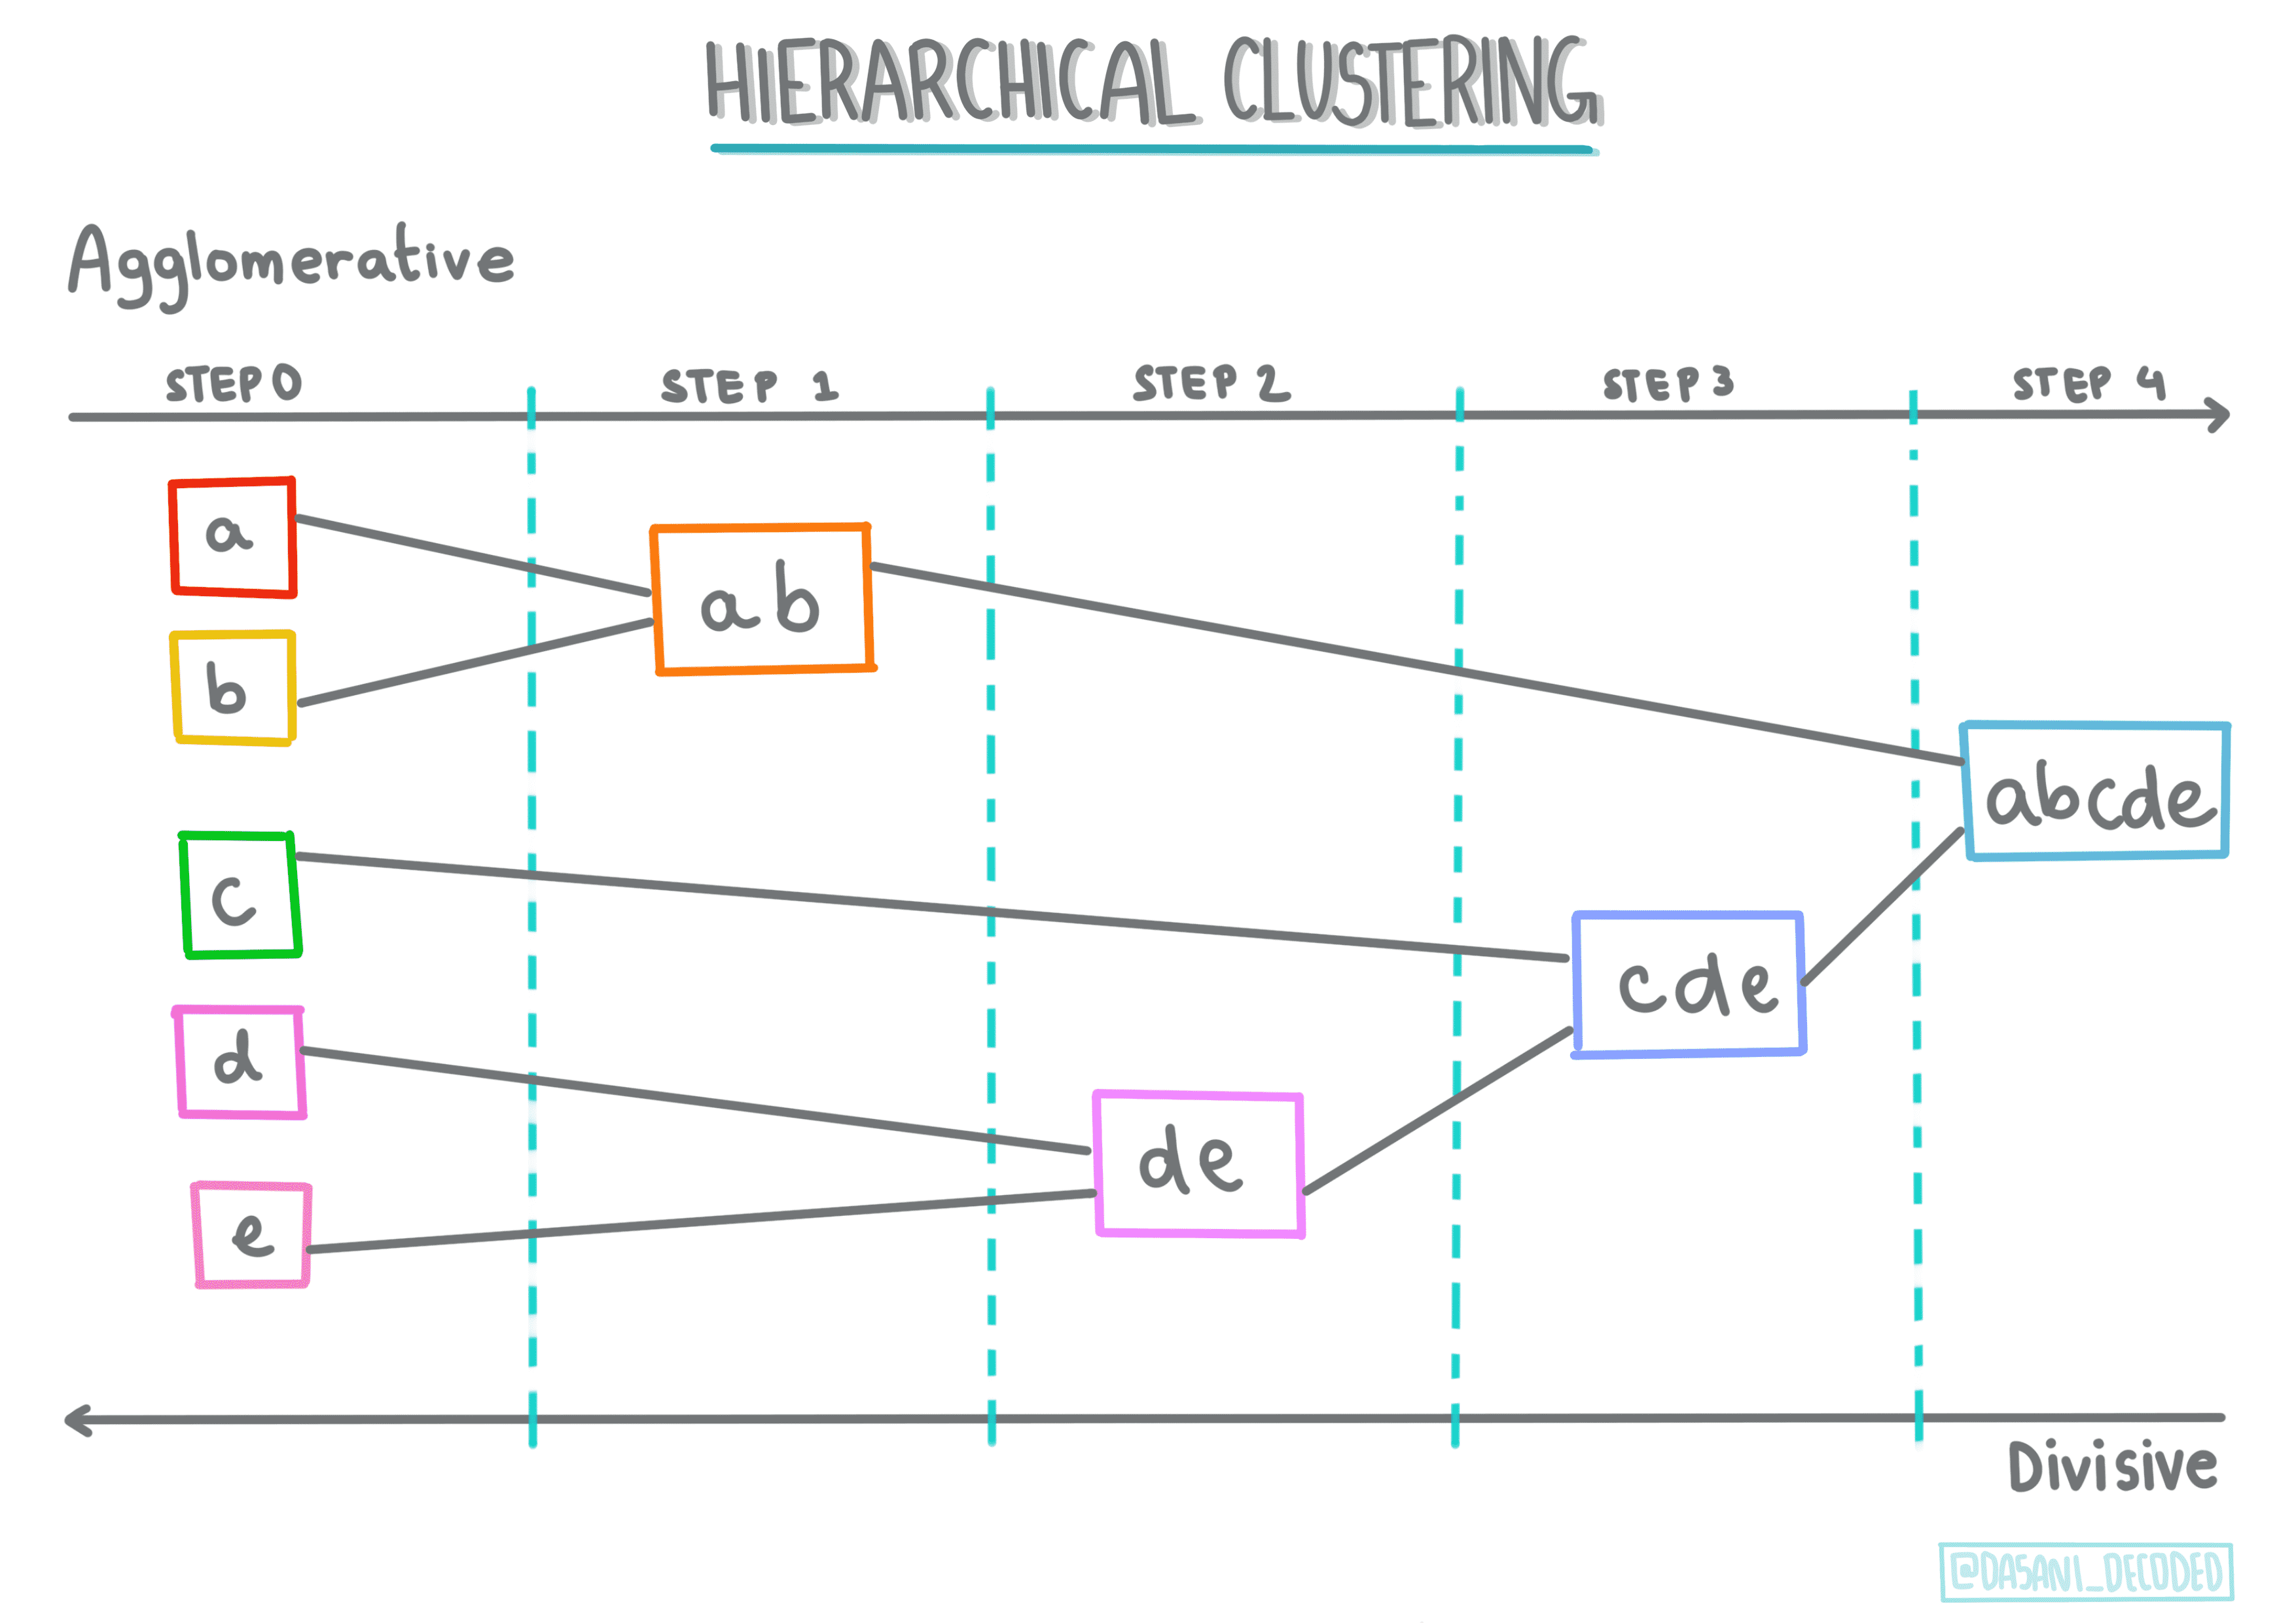
Hierarchical clustering(层次聚类). If an object is classified by its proximity to a nearby object, rather than to one farther away, clusters are formed based on their members’ distance to and from other objects. Scikit-learn's agglomerative clustering is hierarchical.
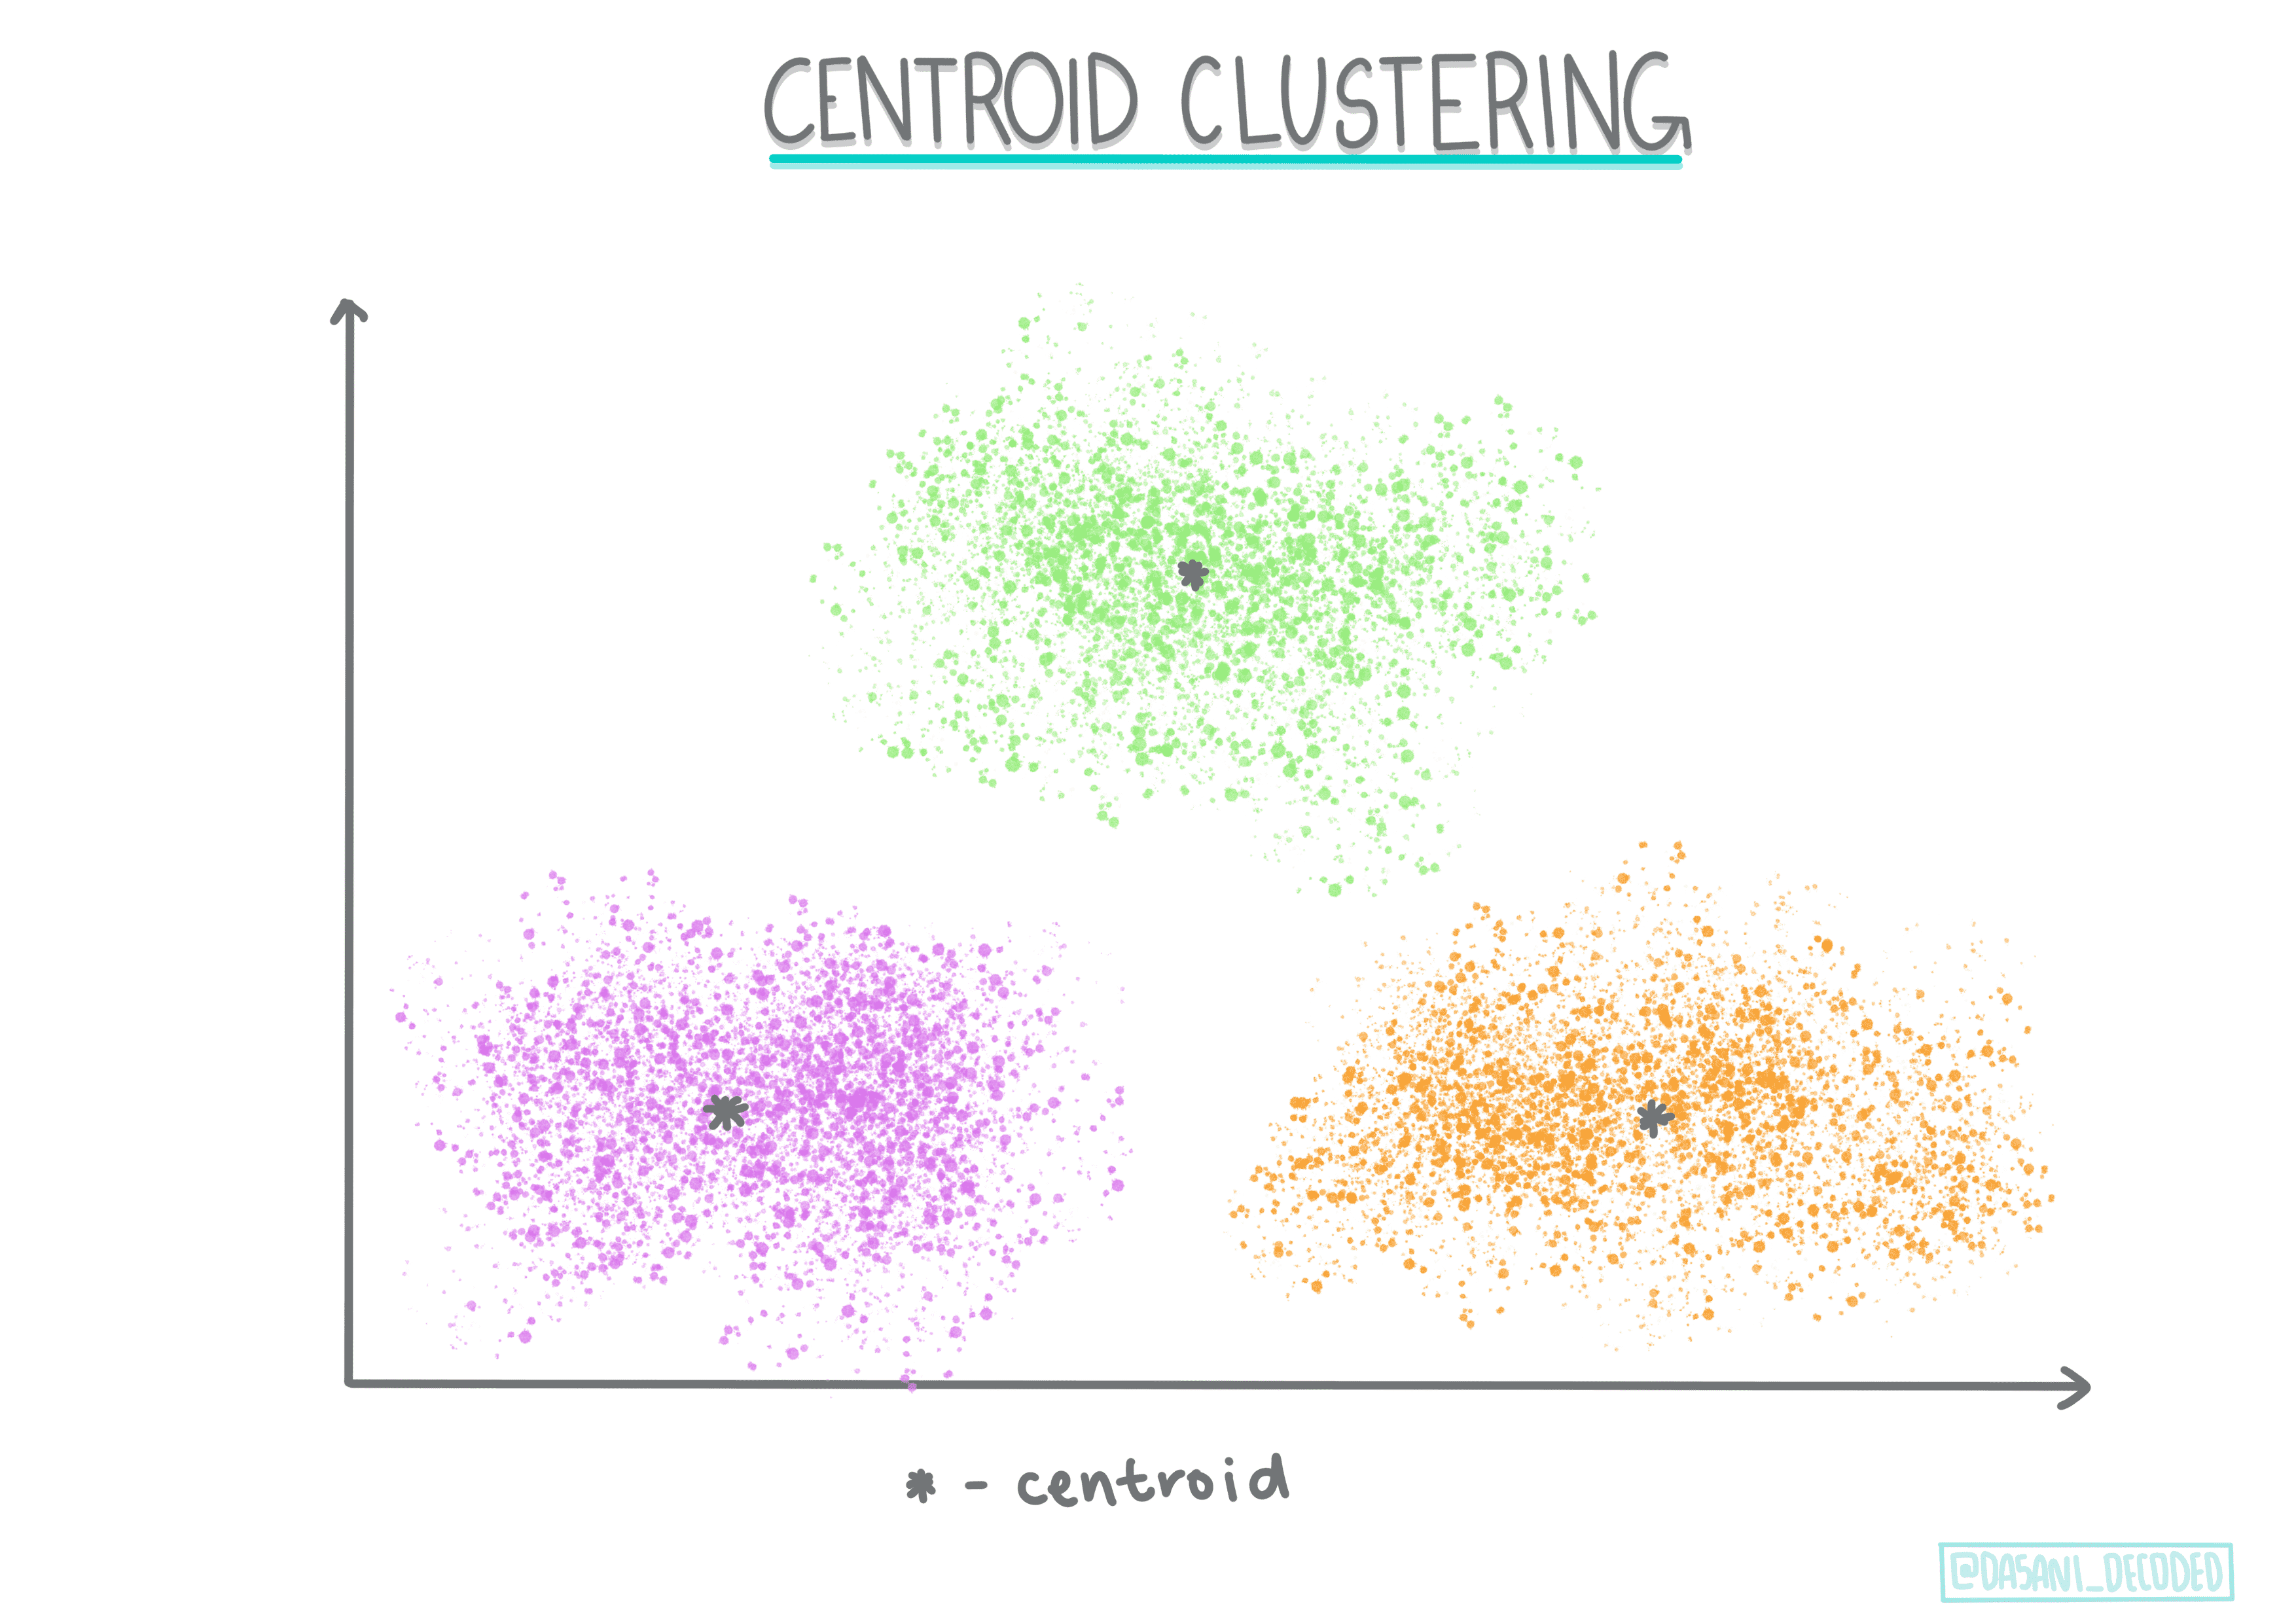
Centroid clustering(质心聚类). This popular algorithm requires the choice of ‘k’, or the number of clusters to form, after which the algorithm determines the center point of a cluster and gathers data around that point. K-means clustering is a popular version of centroid clustering. The center is determined by the nearest mean, thus the name. The squared distance from the cluster is minimized.
Distribution-based clustering(基于分布的聚类). Based in statistical modeling, distribution-based clustering centers on determining the probability that a data point belongs to a cluster, and assigning it accordingly. Gaussian mixture methods belong to this type.
Density-based clustering(基于密度的聚类). Data points are assigned to clusters based on their density, or their grouping around each other. Data points far from the group are considered outliers or noise. DBSCAN, Mean-shift and OPTICS belong to this type of clustering.
Grid-based clustering(基于网格的聚类). For multi-dimensional datasets, a grid is created and the data is divided amongst the grid’s cells, thereby creating clusters.
2. K-Means clustering
备注
具体详情参见demo_python项目下demo_nigerian-songs
K-Means Clustering is a method derived from the domain of signal processing. It is used to divide and partition groups of data into ‘k’ clusters using a series of observations. Each observation works to group a given datapoint closest to its nearest ‘mean’, or the center point of a cluster.
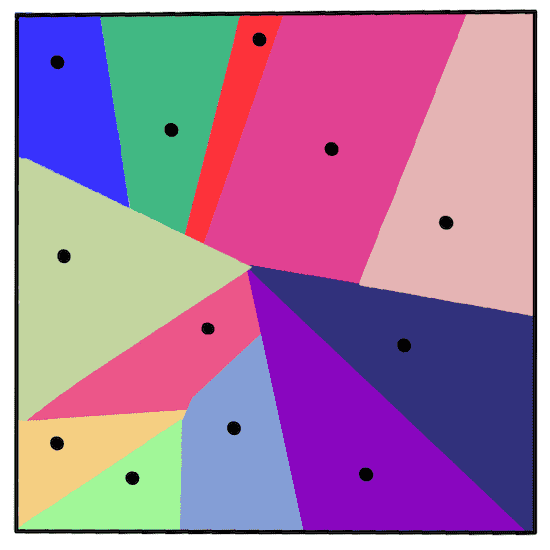
The clusters can be visualized as Voronoi diagrams, which include a point (or ‘seed’) and its corresponding region.
The K-Means clustering process executes in a three-step process
The algorithm selects k-number of center points by sampling from the dataset.
After this, it loops:
    1. It assigns each sample to the nearest centroid.
    2. It creates new centroids by taking the mean value of all of the samples assigned to the previous centroids.
    3. Then, it calculates the difference between the new and old centroids and repeats until the centroids are stabilized.
K-Means 聚类的基本过程:
1. 初始化: 随机选择 K 个数据点作为初始的聚类中心。
2. 分配数据点: 对于每个数据点,计算其与各个聚类中心的距离,并将其分配到距离最近的聚类中心所代表的簇。
3. 更新聚类中心: 对于每个簇,计算其所有数据点的均值,将该均值作为新的聚类中心。
4. 重复步骤 2 和 3: 重复执行步骤 2 和 3,直到聚类中心不再发生明显变化,或者达到预定的迭代次数。
5. 收敛: 算法在达到收敛条件时停止迭代,此时各个簇的中心基本不再改变。
K-Means 算法的优化目标是最小化所有数据点到其所属簇中心的距离之和,即最小化簇内的方差。这一目标函数称为簇内平方和(Within-Cluster Sum of Squares,WCSS)。
需要注意的是,K-Means 算法的结果可能受初始聚类中心的选择影响,因此可以通过多次运行算法并选择效果最好的结果来提高算法的稳定性。
K-Means 聚类的应用场景:
客户细分: 可以根据客户的购物行为、浏览记录等信息将客户划分成不同的细分市场,以便更好地进行营销。
文档聚类: 可以根据文档的内容相似度将文档聚类,以便更好地进行信息检索。
图像分割: 可以根据图像的像素颜色、纹理等信息将图像分割成不同的区域,以便更好地进行图像识别。
[Simulator]K-Means Clustering Demo(可视化样本数据点并确定其质心): https://user.ceng.metu.edu.tr/~akifakkus/courses/ceng574/k-means/
Stanford大学的K Means文档: https://stanford.edu/~cpiech/cs221/handouts/kmeans.html
6. NLP
1. Introduction to NLP
自然语言处理(Natural Language Processing, NLP)是机器学习在生产软件中应用最广泛的领域之一。
计算语言学 (Computational Linguistics) 是一个经过几十年研究和发展的领域,它研究如何让计算机能使用、理解、翻译语言并使用语言交流。自然语言处理(NLP)是计算语言学中一个专注于计算机如何处理「自然的」(或者说,人类的)语言的相关领域。
2. Common NLP tasks and techniques
Tasks common to NLP
Tokenization
The first thing most NLP algorithms have to do is to split the text into tokens, or words.
Embeddings
Word embeddings(词嵌入) are a way to convert your text data numerically.
Embeddings are done in a way so that words with a similar meaning or words used together cluster together.
Parsing & Part-of-speech Tagging
Every word that has been tokenized can be tagged as a part of speech(词性) - a noun, verb, or adjective.
Word and Phrase Frequencies
A useful procedure when analyzing a large body of text is to build a dictionary of every word or phrase of interest and how often it appears.
N-grams
A text can be split into sequences of words of a set length, a single word (unigram), two words (bigrams), three words (trigrams) or any number of words (n-grams).
It might be easier to visualize it as a sliding box(滑动框) over the sentence.
示例: (n-grams of 3 words):
the quick red fox jumped over the lazy brown dog
=>
1. the quick red
2. quick red fox
3. red fox jumped
4. fox jumped over
5. jumped over the
6. over the lazy
7. the lazy brown
8. lazy brown dog
Noun phrase Extraction
In most sentences, there is a noun that is the subject, or object of the sentence.
示例: In the sentence the quick red fox jumped over the lazy brown dog there are 2 noun phrases: quick red fox and lazy brown dog.
Sentiment analysis
情感分析
A sentence or text can be analysed for sentiment, or how positive or negative it is.
Sentiment is measured in polarity and objectivity/subjectivity. Polarity is measured from -1.0 to 1.0 (negative to positive) and 0.0 to 1.0 (most objective to most subjective).
情绪是通过极性和客观性 / 主观性来衡量的。极性的测量范围是 -1.0 到 1.0(负到正)和 0.0 到 1.0(最客观到最主观)。
Inflection
词形变化
Inflection enables you to take a word and get the singular or plural of the word.
Lemmatization
词形还原
A lemma is the root or headword for a set of words, for instance flew, flies, flying have a lemma of the verb fly.
WordNet
WordNet is a database of words, synonyms, antonyms and many other details for every word in many different languages. It is incredibly useful when attempting to build translations, spell checkers, or language tools of any type.
NLP Libraries
TextBlob library
3. Translation and sentiment analysis with ML
Exercise - translation:
from textblob import TextBlob

blob = TextBlob(
    "It is a truth universally acknowledged, that a single man in possession of a good fortune, must be in want of a wife!"
)
print(blob.translate(to="fr"))
Exercise - sentimental sentences:
from textblob import TextBlob

quote1 = """It is a truth universally acknowledged, that a single man in possession of a good fortune, must be in want of a wife."""

quote2 = """Darcy, as well as Elizabeth, really loved them; and they were both ever sensible of the warmest gratitude towards the persons who, by bringing her into Derbyshire, had been the means of uniting them."""

sentiment1 = TextBlob(quote1).sentiment
sentiment2 = TextBlob(quote2).sentiment

print(quote1 + " has a sentiment of " + str(sentiment1))
print(quote2 + " has a sentiment of " + str(sentiment2))
4. Preparing your data
备注
具体详情参见demo_python项目下demo_Hotel_Reviews
5. NLTK for Sentiment Analysis
NLTK 是自然语言处理工具包(Natural Language Toolkit)的缩写
备注
具体详情参见demo_python项目下demo_Hotel_Reviews
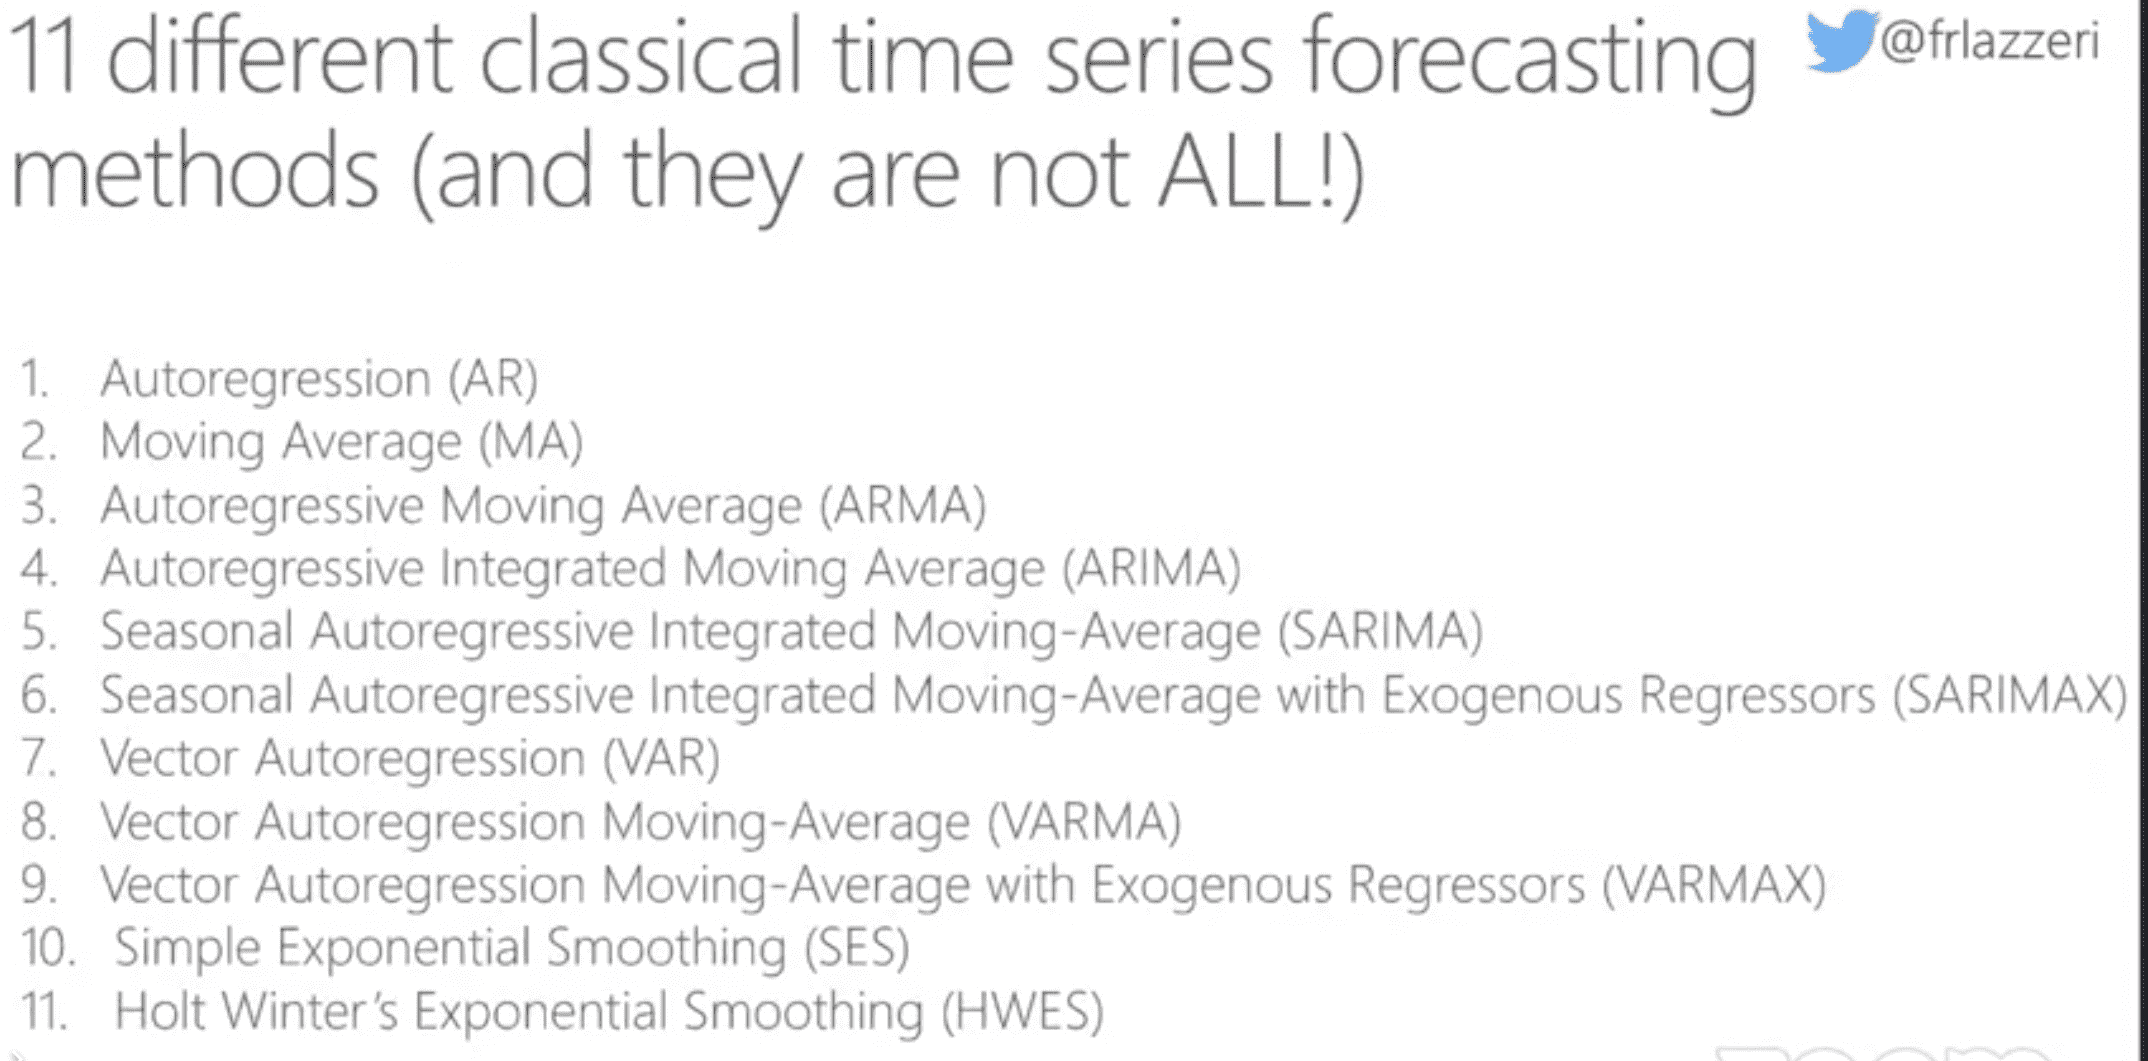
7. TimeSeries
Time series forecasting, a somewhat lesser known area of machine learning that is nevertheless extremely valuable for industry and business applications, among other fields.
1. Introduction to time series forecasting
备注
具体详情参见demo_python项目下demo_Energy
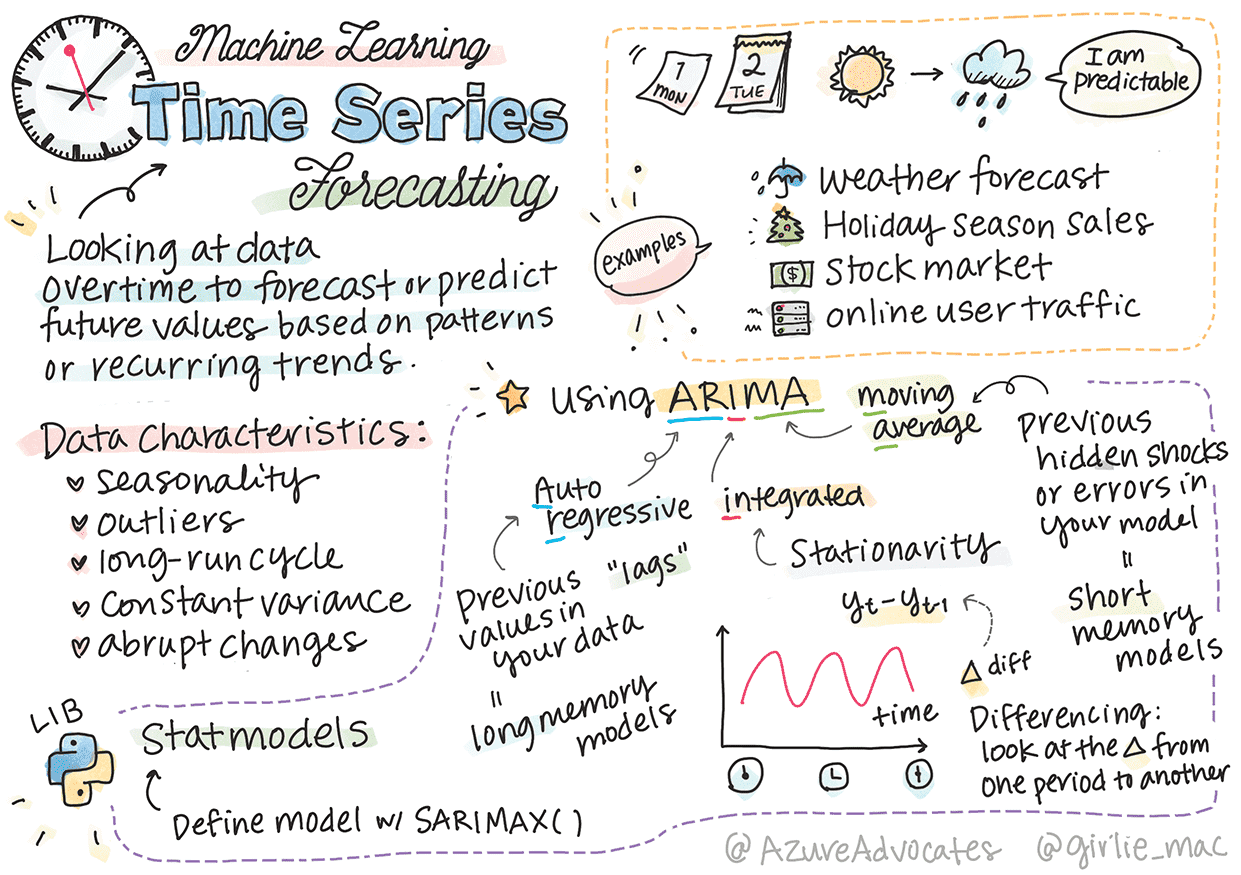
在数学中,“时间序列是按时间顺序索引(或列出或绘制)的一系列数据点。最常见的是,时间序列是在连续的等间隔时间点处获取的序列。”
时间序列图和统计建模的使用在信号处理、天气预报、地震预测以及其他可以随时间推移发生事件并绘制数据点的领域中经常遇到。
Here are some concepts you should know to be able to work with time series:
Trends
    趋势被定义为随着时间的推移可测量的增加和减少
Seasonality
    季节性被定义为周期性波动,例如可能影响销售的假期高峰。
Outliers
    异常值远离标准数据方差
Long-run cycle
    长期周期,例如持续超过一年的经济衰退
Constant variance
    恒定方差: 随着时间的推移,一些数据会显示出持续的波动,例如每天和晚上的能源使用情况。
Abrupt changes
    数据可能会显示可能需要进一步分析的突然变化。例如,由于新冠疫情导致企业突然关闭,导致数据发生变化。
2. Building ARIMA time series models
备注
具体详情参见demo_python项目下demo_Energy
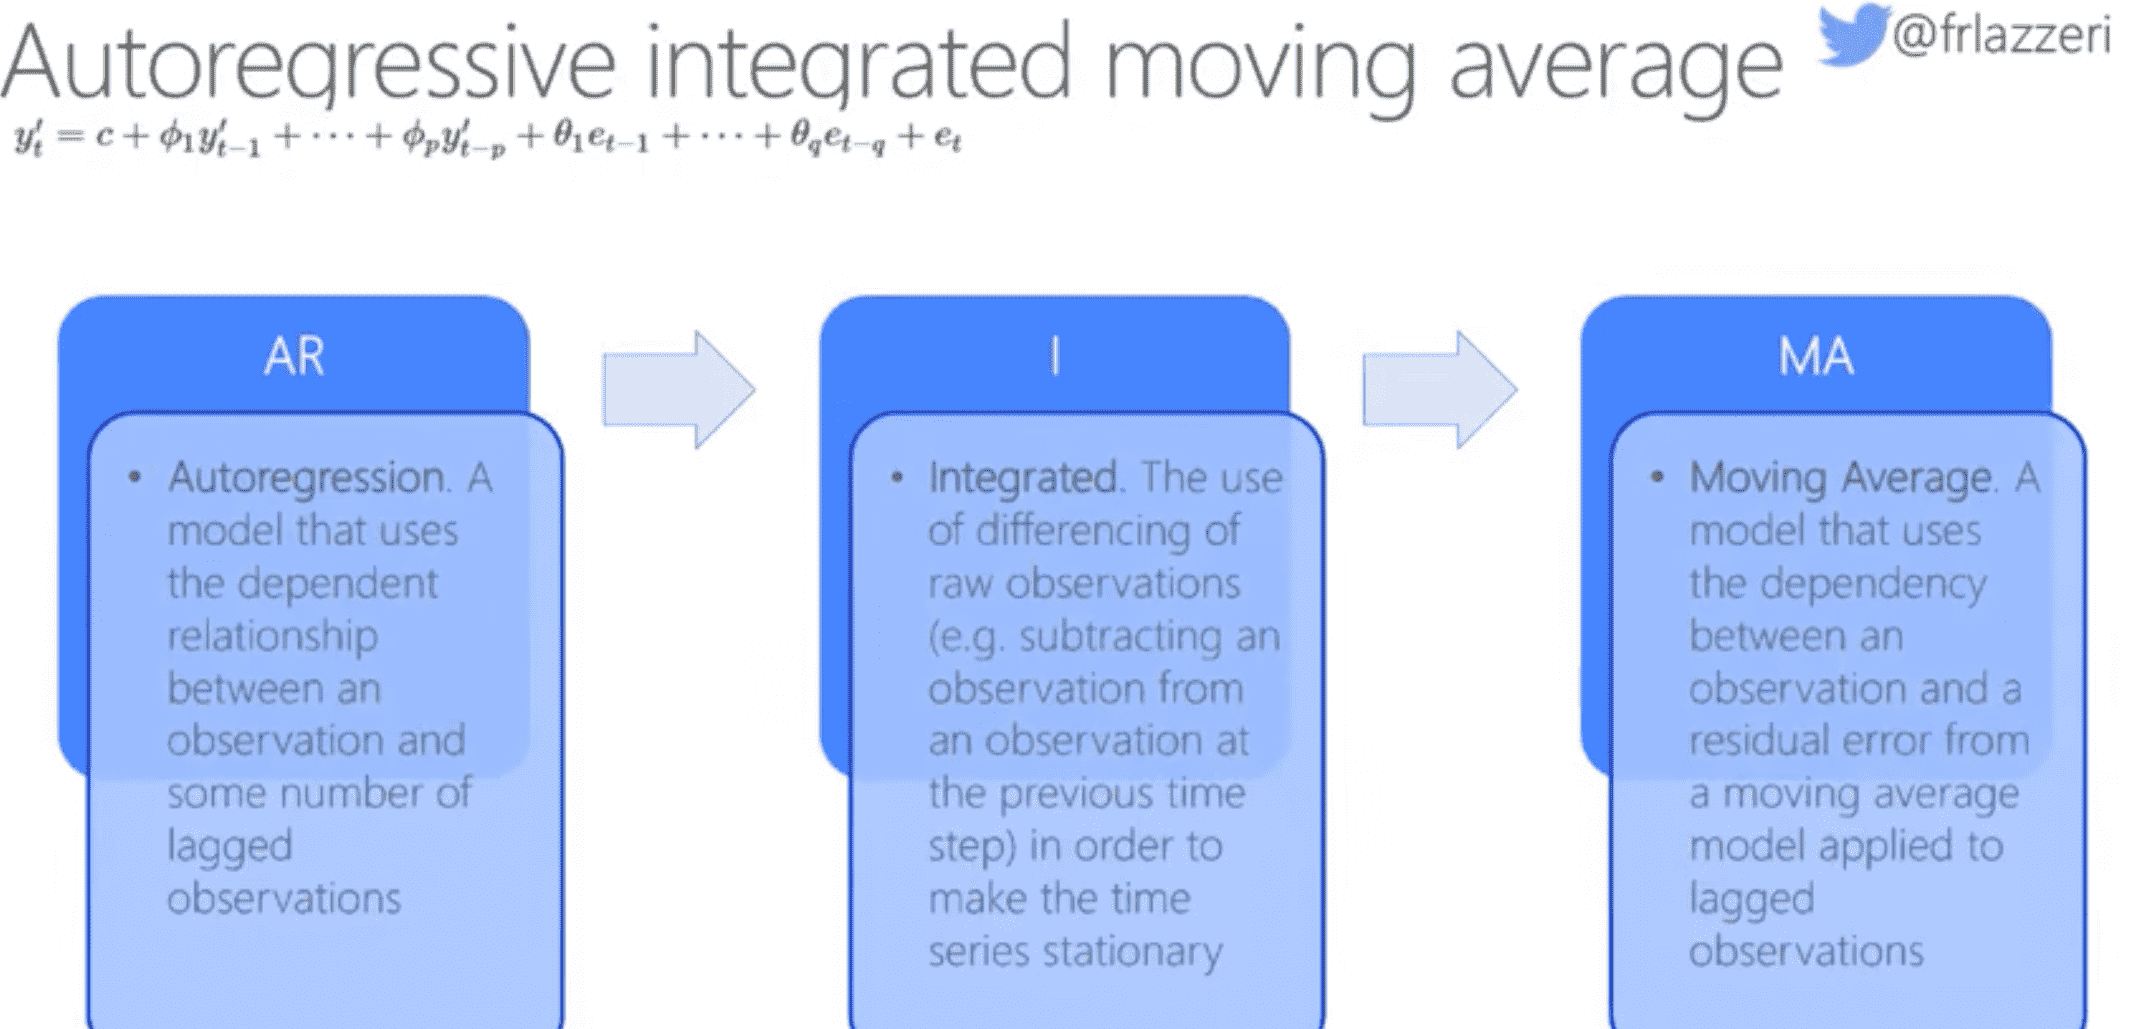
ARIMA: AutoRegressive Integrated Moving Average
ARIMA models are particularly suited to fit data that shows non-stationarity.(ARIMA 模型特别适合拟合显示非平稳性的数据)
ARIMA 是用于预测时间序列数据统计线性方法
General concepts
Stationarity
    平稳性。从统计角度来看,平稳性是指数据随时间变化分布不会改变
Differencing
    差分。差分数据是指通过消除非恒定趋势来转换非平稳数据以使其平稳的过程。
    差分消除了时间序列水平的变化,消除了趋势和季节性,从而稳定了时间序列的平均值
ARIMA in the context of time series
AR - for AutoRegressive. Autoregressive models, as the name implies, look ‘back’ in time to analyze previous values in your data and make assumptions about them. These previous values are called ‘lags’. An example would be data that shows monthly sales of pencils. Each month’s sales total would be considered an ‘evolving variable’ in the dataset. This model is built as the “evolving variable of interest is regressed on its own lagged (i.e., prior) values.” wikipedia
I - for Integrated. As opposed to the similar ‘ARMA’ models, the ‘I’ in ARIMA refers to its integrated aspect. The data is ‘integrated’ when differencing steps are applied so as to eliminate non-stationarity.
MA - for Moving Average. The moving-average aspect of this model refers to the output variable that is determined by observing the current and past values of lags.
备注
ARIMA is used to make a model fit the special form of time series data as closely as possible.ARIMA 用于使模型尽可能贴近时间序列数据的特殊形式。
3. Building SVR for time series forcasting
Support Vector Regressor
In this lesson, you will discover a specific way to build models with SVM: Support Vector Machine for regression, or SVR: Support Vector Regressor.
SVR 是用于预测时间序列数据统计非线性方法
the important concepts:
1. Regression:
    Supervised learning technique to predict continuous values from a given set of inputs.
2. Support Vector Machine (SVM):
    A type of supervised machine learning model used for classification, regression and outliers detection.
3. Support Vector Regressor (SVR):
    A type of SVM, to find the best fit line (which in the case of SVM is a hyperplane) that has the maximum number of data points.
8. Reinforcement
备注
具体详情参见demo_python项目下demo_Reinforcement
Reinforcement learning, RL, is seen as one of the basic machine learning paradigms, next to supervised learning and unsupervised learning. RL is all about decisions: delivering the right decisions or at least learning from them.
Semi-supervised learning, where we have a lot of unlabeled data that can be used to pre-train the model.
Reinforcement learning, in which an agent learns how to behave by performing experiments in some simulated environment.
Reinforcement Learning (RL) is based on the idea of making the computer play many times and observing the result. Thus, to apply Reinforcement Learning, we need two things:
1. An environment and a simulator which allow us to play a game many times.
    This simulator would define all the game rules as well as possible states and actions.
2. A reward function,
    which would tell us how well we did during each move or game.
备注
The main difference between other types of machine learning and RL is that in RL we typically do not know whether we win or lose until we finish the game(chess or Super Mario). Thus, we cannot say whether a certain move alone is good or not - we only receive a reward at the end of the game. And our goal is to design algorithms that will allow us to train a model under uncertain conditions.
1. Introduction to reinforcement learning and Q-Learning
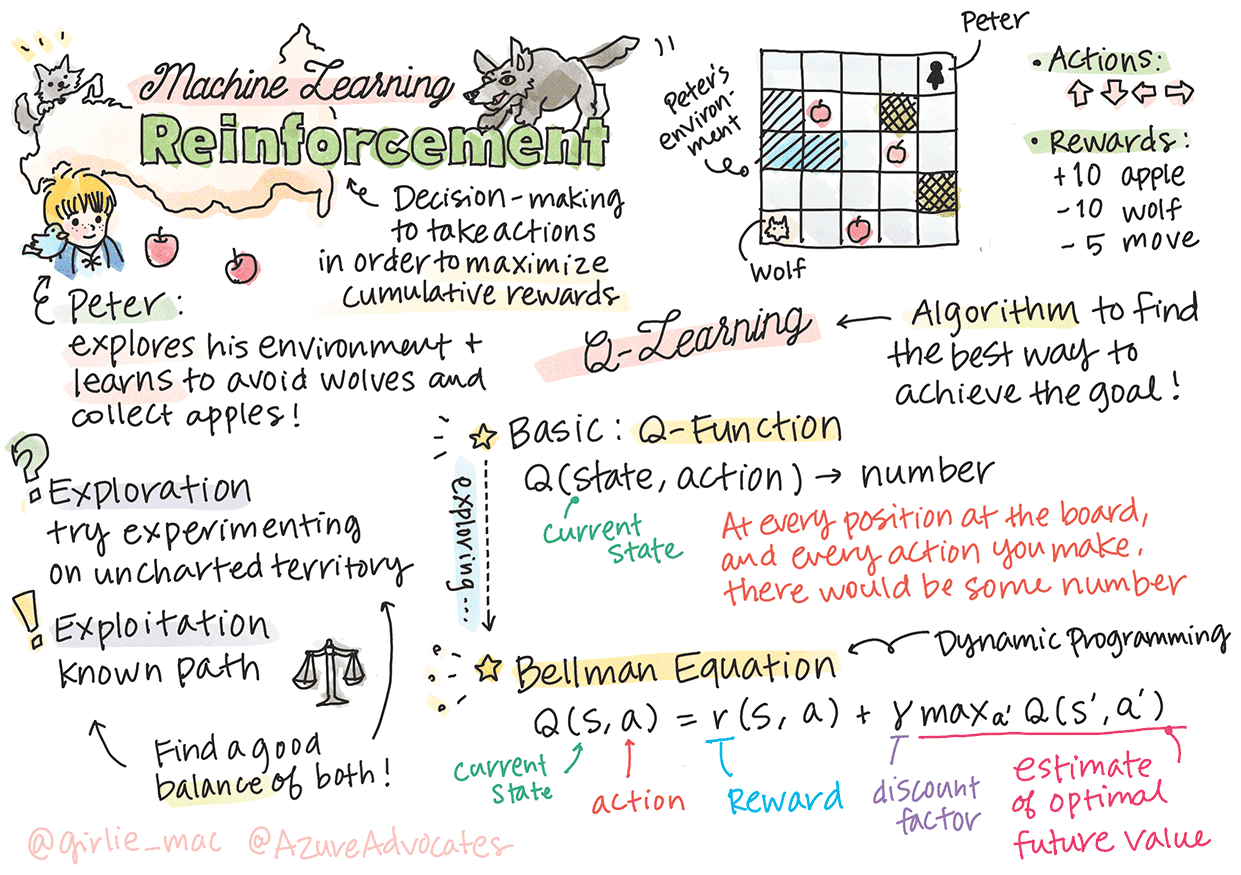
在超级马里奥里。你是马里奥,你在一个游戏关卡中,站在悬崖边上。在你上面是一枚硬币。你是马里奥,在游戏关卡里,在特定位置……这就是你的状态。向右移动一步(一个动作)会让跌下悬崖,而且会得到一个低分。然而,按下跳跃按钮会让你活下来并得分。这是一个积极的结果,它会给你一个积极、正向的分数。
在 Q-Learning 算法中,策略由称为 Q-Table 的函数(或数据结构)定义。它记录了给定状态下每个动作的”幸运值”。之所以称为 Q-Table,是因为表格或多维数组通常表示起来很方便。
Essence of Q-Learning: Bellman Equation
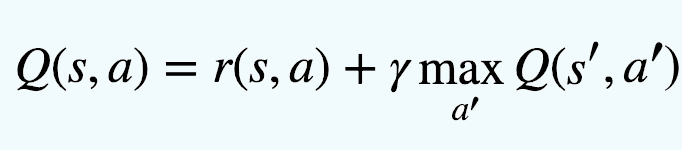
Bellman 公式。这里 γ 是所谓的折扣因子,它决定了你应该在多大程度上更喜欢当前的奖励而不是未来的奖励。
2. Using a gym simulation environment
Gym is a standard API for reinforcement learning, and a diverse collection of reference environments
OpenAI Gym: https://gymnasium.farama.org/
OpenAI Gym(old): https://www.gymlibrary.dev/
OpenAI Gym(more older): https://gym.openai.com
One of the most popular simulation environments for training reinforcement learning algorithms is called a Gym, which is maintained by OpenAI.
9. Real-World
1. Real-World Applications for ML
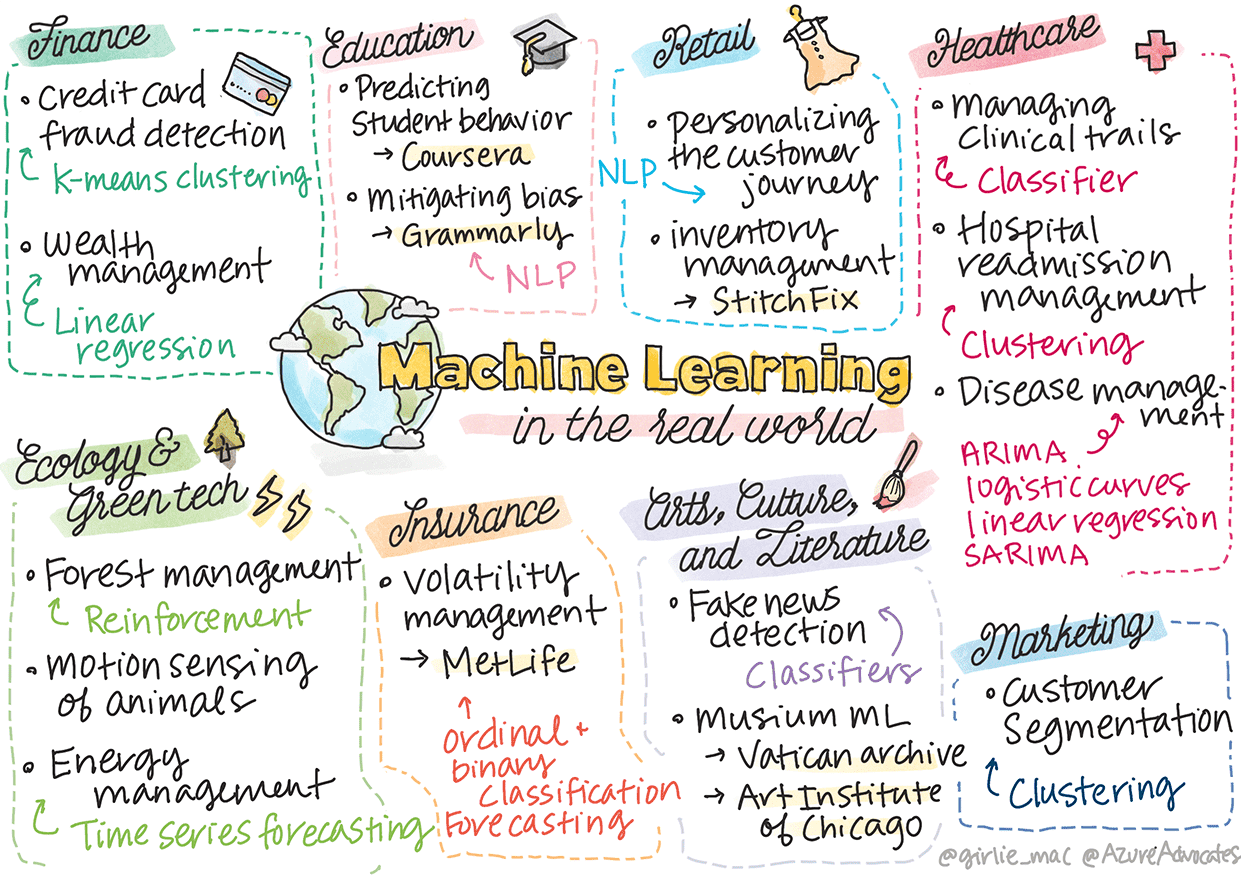
Finance:
Credit card fraud detection(k-means clustering )
Wealth management(Linear regression)
Education:
Predicting student behavior
Mitigating bias(NLP)
Retail:
Personalizing the customer journey(NLP)
Inventory management
Health Care:
Managing clinical trials(Classifier)
Hospital readmission management(Clustering)
Disease management(ARIMA, logistic curves, linear regression, and SARIMA)
Ecology and Green Tech:
Forest management(Reinforcement)
Motion sensing of animals
Energy Management(Time Series Forecasting)
Insurance:
Volatility Management(binary and ordinal classification, forecasting)
Arts, Culture, and Literature:
Fake news detectionCustomer segmentation
Museum ML
Marketing:
Customer segmentation(Clustering)
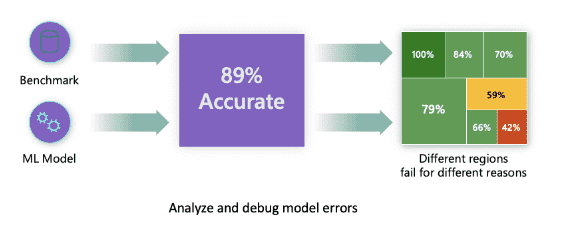
2. Model Debugging in ML using Responsible AI dashboard components
model debugging method:
1. Error Analysis
    确定模型在数据分布中的何处具有较高错误率
2. Model Overview
    对不同数据组进行比较分析,以发现模型性能指标的差异
3. Data Analysis
    调查数据的代表性是否过多或不足,从而使模型有偏见
4. Feature Importance
    了解哪些特征正在推动模型在全局级别或局部级别的预测

Fairness, Explainability, Error analysis
Error Analysis
RAI 仪表板上的错误分析组件通过树形可视化说明了模型故障如何分布在各个队列中。这对于识别数据集错误率较高的要素或区域非常有用。
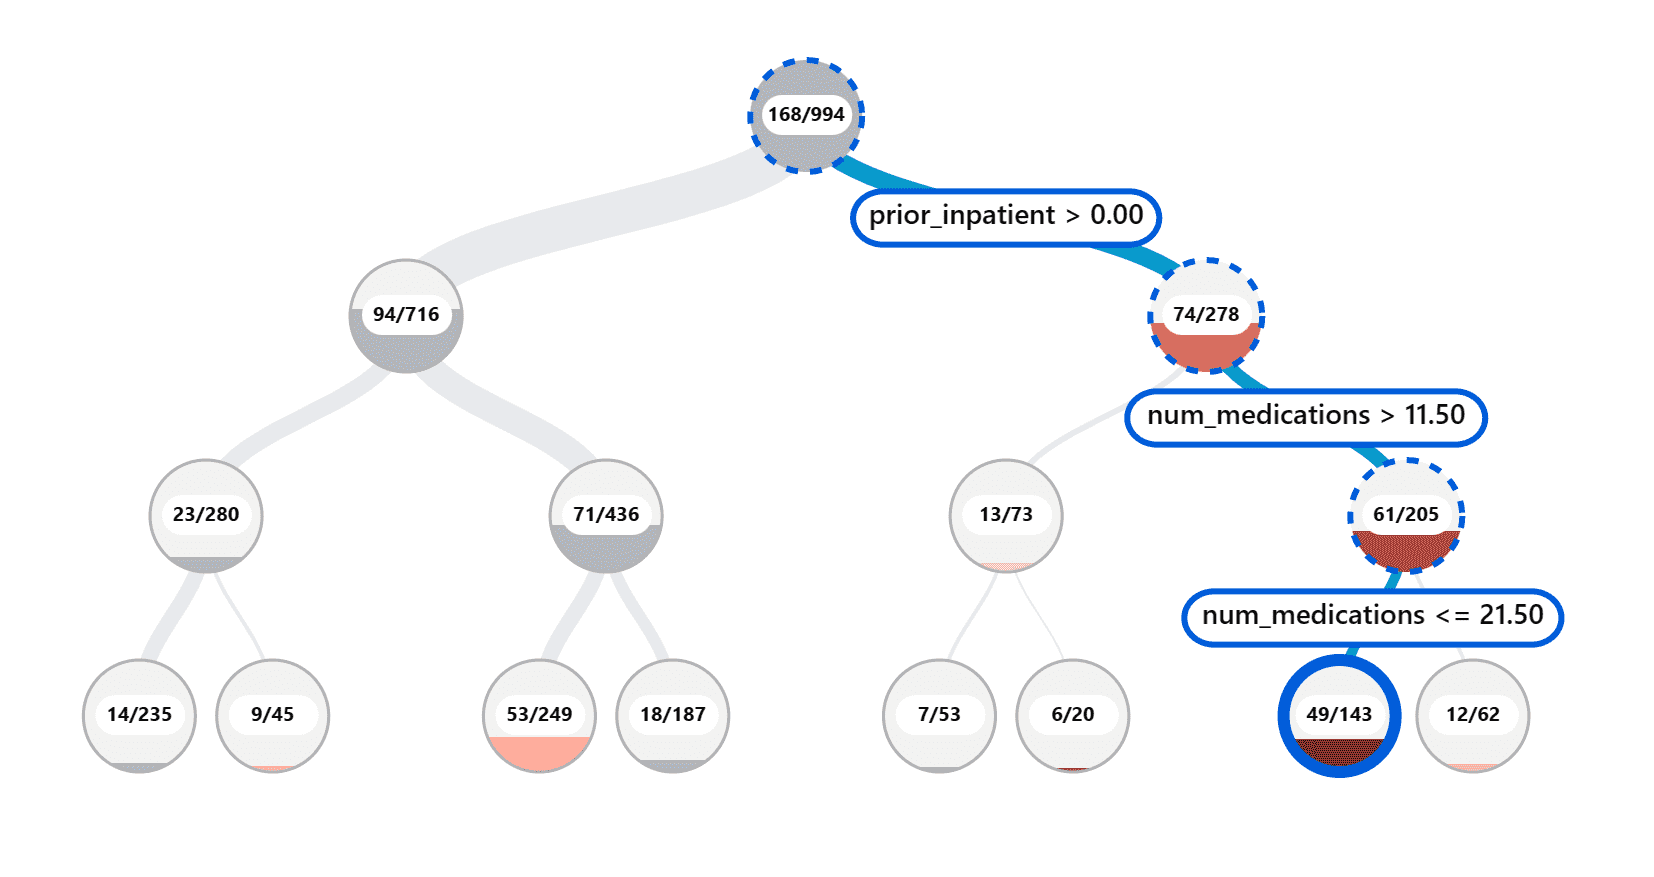
树形图上的视觉指示器有助于更快地找到问题区域。例如,树节点的红色阴影越深,错误率就越高。
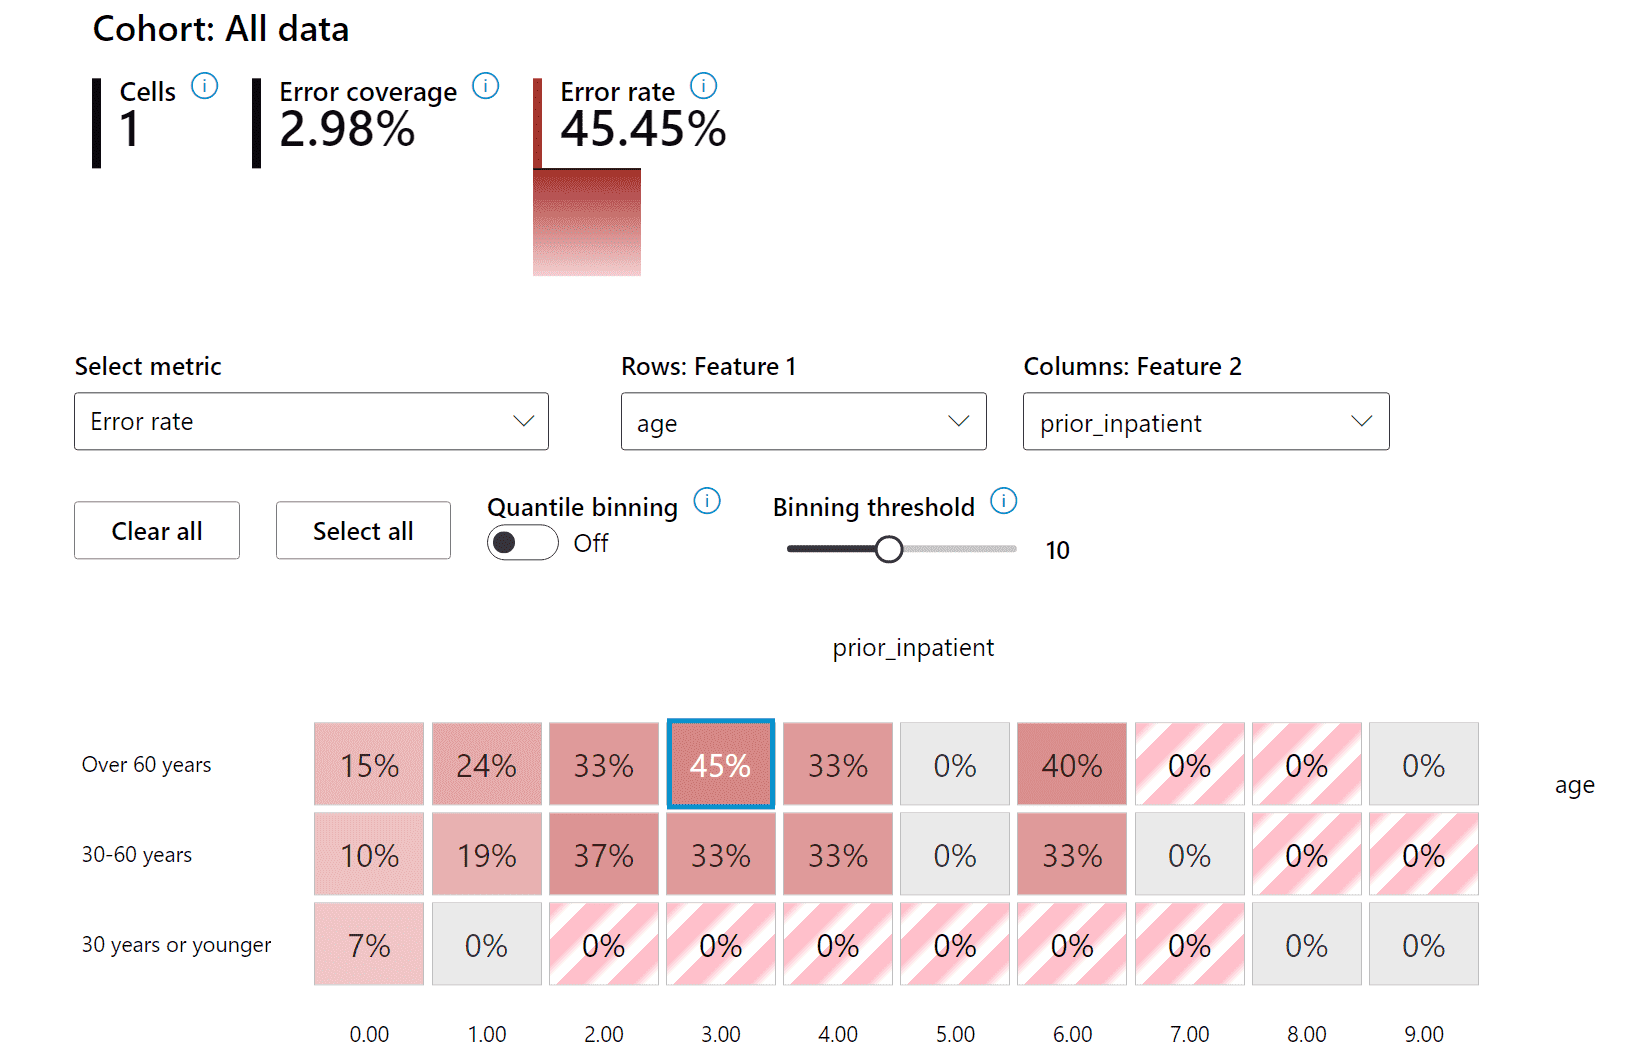
热图是另一种可视化功能,用户可以使用它来调查错误率,使用一个或两个特征来查找整个数据集或群组中模型错误的贡献者。
Model Overview
评估机器学习模型的性能需要对其行为有全面的了解。这可以通过检查多个指标来实现,例如错误率、准确度、召回率、精确度或 MAE(平均绝对误差),以找出性能指标之间的差异。一个性能指标可能看起来不错,但另一个指标可能会暴露出不准确的地方。
Disparity in model performance:
Disparity in accuracy rate
Disparity in error rate
Disparity in precision
Disparity in recall
Disparity in mean absolute error (MAE)
Data Analysis
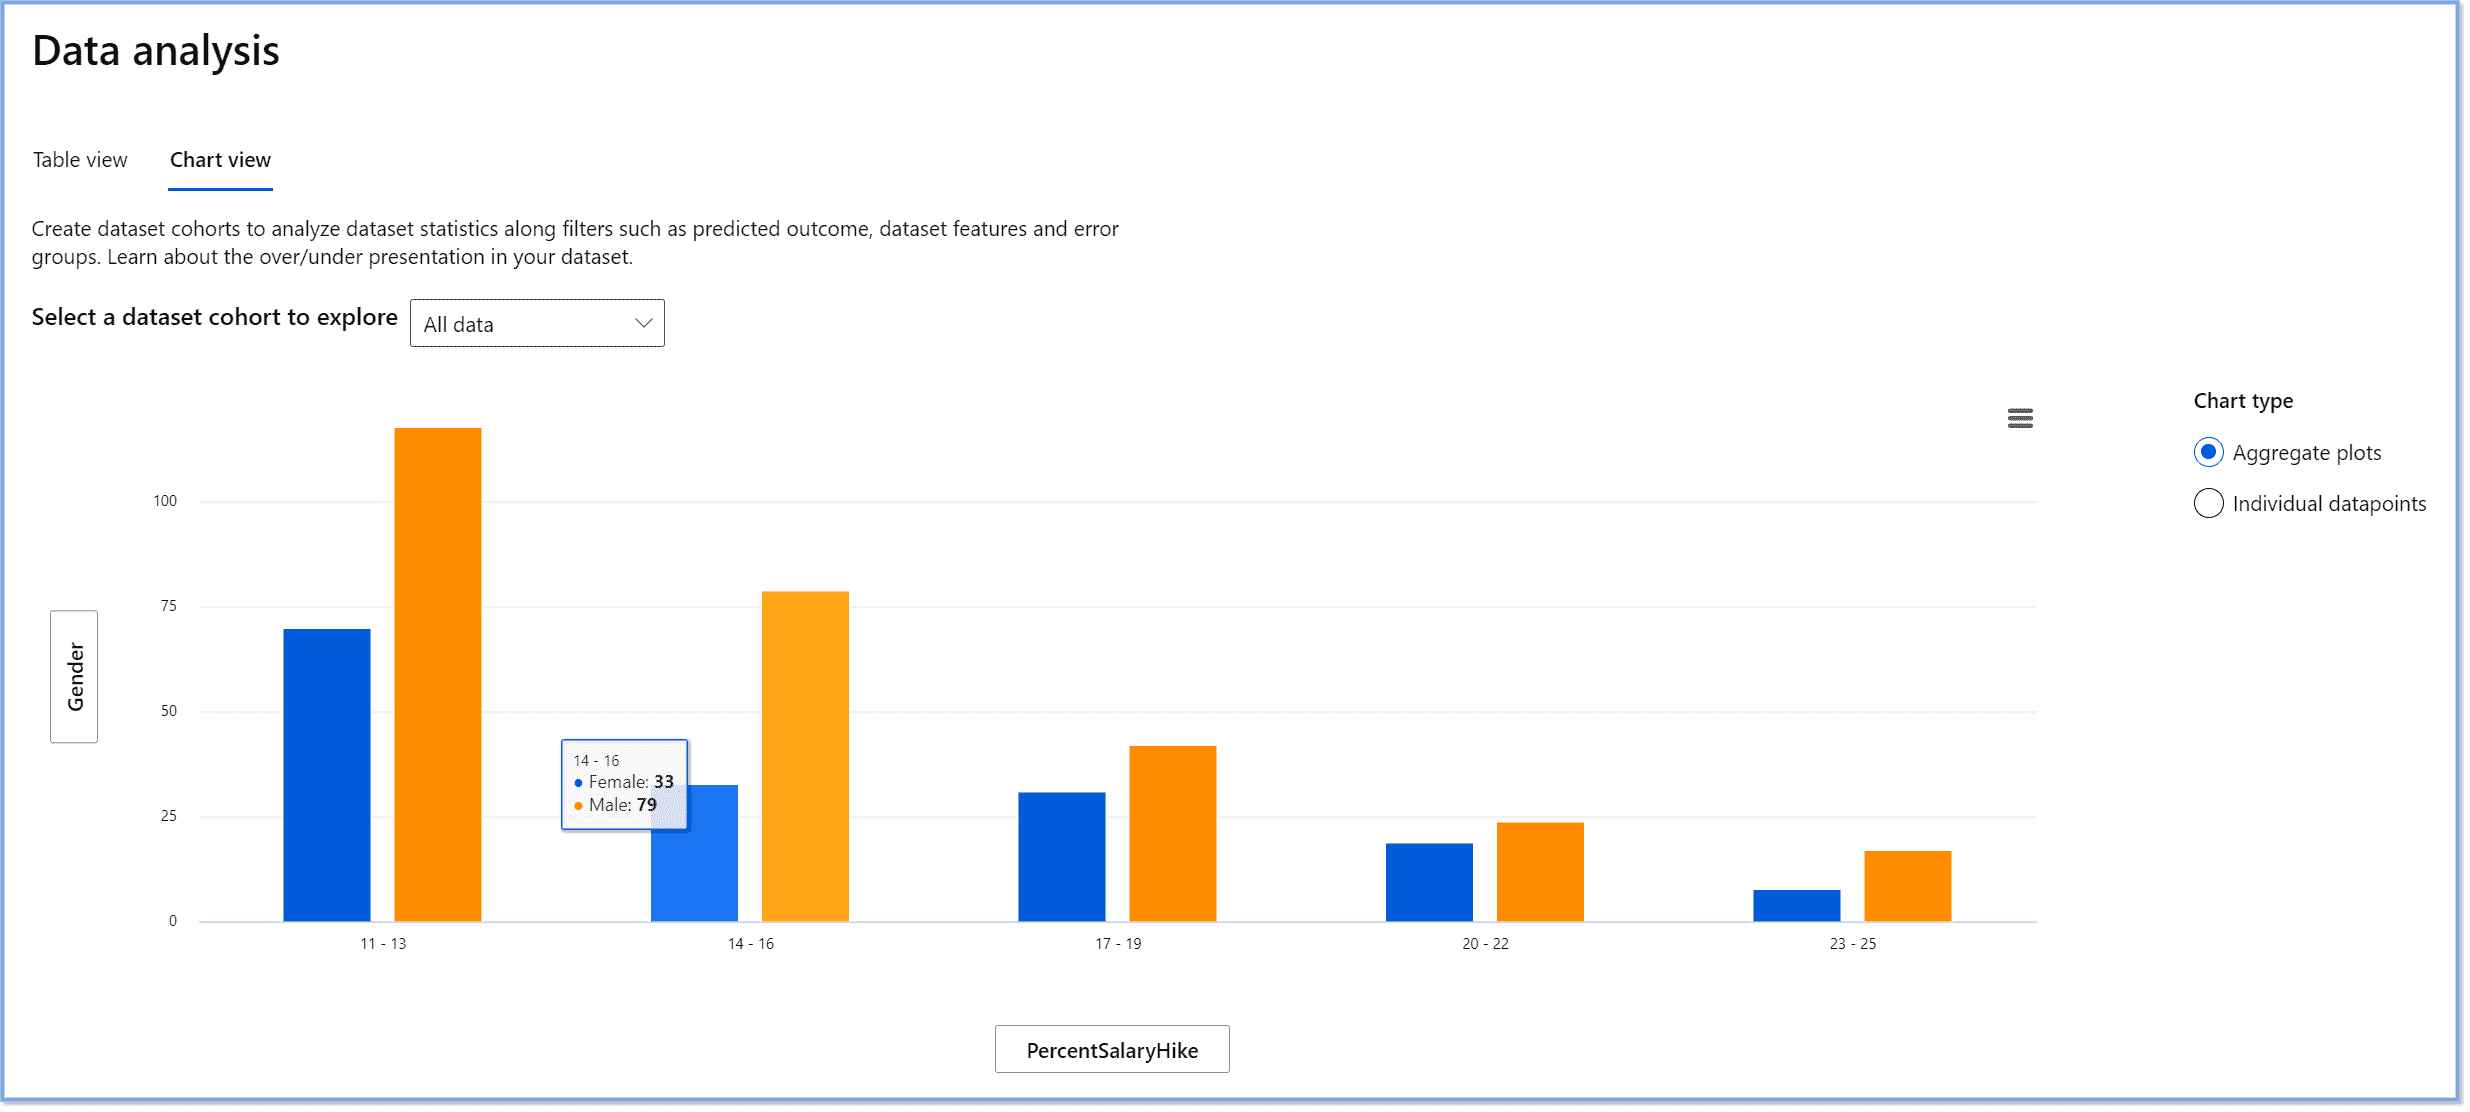
Use data analysis when you need to:
1. Explore your dataset statistics by selecting different filters to slice your data into different dimensions (also known as cohorts).
2. Understand the distribution of your dataset across different cohorts and feature groups.
3. Determine whether your findings related to fairness, error analysis, and causality (derived from other dashboard components) are a result of your dataset's distribution.
4. Decide in which areas to collect more data to mitigate errors that come from representation issues, label noise, feature noise, label bias, and similar factors.
Model Interpretability
机器学习模型往往是黑匣子。了解哪些关键数据特征驱动模型的预测可能具有挑战性。提供模型为何做出特定预测的透明度非常重要。
Model explainability and interpretability helps answer questions in scenarios such as:
Model debugging: Why did my model make this mistake? How can I improve my model?
Human-AI collaboration: How can I understand and trust the model’s decisions?
Regulatory compliance: Does my model satisfy legal requirements?