2404.16130_GraphRAG: From Local to Global: A GraphRAG Approach to Query-Focused Summarization
引用: 688(2025-07-22)
组织: Microsoft
总结
简介
核心思想
将传统的检索增强生成(RAG)方法从线性文档结构扩展到图结构,利用图数据更好地建模复杂语义关系
从“局部”(如实体、段落)到“全局”(如主题、整体结构)多粒度地检索和生成摘要内容
GraphRAG
结合检索增强生成(RAG)和查询聚焦摘要(QFS)的优势
方法
通过两个阶段使用LLM构建图索引
第一阶段:从源文档中提取实体知识图谱
第二阶段:为每个紧密相关的实体组(社区)预先生成摘要
在回答问题时
先基于每个社区的摘要生成partial答案,再将所有partial答案汇总为最终答案
框架
知识图谱构建:使用LLM从文本中提取关键实体和它们之间的关系,构建知识图谱。
社区划分与层级化:将图谱划分为多个层次化的紧密关联实体社区。
社区摘要生成:自底向上地为每个社区生成摘要,高层摘要融合低层摘要,从而形成全局描述。
查询处理:通过 map-reduce 方式,使用社区摘要生成partial回答,并最终整合为一个全局回答。
LLM-as-a-judge 技术
首先使用一个 LLM 根据语料库特定的用例生成一组不同的全局意义建构问题
使用这些问题作为输入,从Rag 中检索答案
然后使用第二个 LLM 根据预定义标准判断两个不同 RAG 系统的答案
从自然语言文本中提取知识图谱的方法包括
规则匹配
统计模式识别
聚类
嵌入技术
LLM进行知识图谱提取
LLM 总结
文章《From Local to Global: A GraphRAG Approach to Query-Focused Summarization》提出了一种基于图结构的检索增强生成(GraphRAG)方法,用于实现以查询为中心的摘要生成。
文章的核心思想是将传统的检索增强生成(RAG)方法从线性文档结构扩展到图结构,利用图数据更好地建模复杂语义关系。作者认为,传统的RAG方法在处理复杂或长文档时存在局限性,难以捕捉内容间的深层逻辑关系。为了解决这一问题,文章提出GraphRAG方法,通过构建文档的图表示,从“局部”(如实体、段落)到“全局”(如主题、整体结构)多粒度地检索和生成摘要内容。
GraphRAG的主要步骤包括:
文档图建模:将文档内容建模为图结构,节点表示实体或概念,边表示它们之间的关系。
查询感知的图检索:基于用户查询,在图中检索与查询最相关的子图,从而获取相关信息。
多粒度信息融合:在生成摘要过程中,结合局部细节和全局语义来提高摘要的相关性和完整性。
生成摘要:基于检索到的图结构和查询意图,生成简洁且准确的摘要。
实验结果表明,GraphRAG在多个以查询为中心的摘要任务中表现优于现有方法,尤其是在处理复杂文档结构和多跳推理时具有优势。该方法展示了图结构在信息检索和摘要生成中的潜力,为未来的研究提供了新的方向。
总结:文章提出了GraphRAG方法,通过将文档建模为图结构,并结合查询意图进行多粒度的信息检索和生成,显著提升了以查询为中心的摘要任务的效果。
Abstract
该章节介绍了GraphRAG,这是一种结合了**检索增强生成(RAG)和查询聚焦摘要(QFS)**优势的方法,用于在私有文本语料库上进行问答。主要内容总结如下:
问题背景:
传统的RAG方法通过从外部知识库中检索相关信息,使大语言模型能够回答基于特定文档的问题。
然而,RAG在处理面向整个文本语料库的全局性问题(如“数据集的主要主题是什么?”)时表现不佳,因为这类问题是典型的QFS任务,而非简单的检索任务。
传统的QFS方法虽然能处理全局问题,但难以扩展到RAG系统所能处理的大规模文本数据。
提出方法(GraphRAG):
为解决上述问题,作者提出了GraphRAG,一种基于图结构的方法。
GraphRAG通过两个阶段使用大语言模型构建图索引:
第一阶段:从源文档中提取实体知识图谱。
第二阶段:为每个紧密相关的实体组(社区)预先生成摘要。
在回答问题时,先基于每个社区的摘要生成部分答案,再将所有部分答案汇总为最终答案。
实验结果:
在处理100万token级别的数据集上的全局性问题(global sensemaking questions)中,GraphRAG相比传统RAG方法在答案的全面性和多样性方面有了显著提升。
总结:GraphRAG通过构建实体图谱和社区摘要,成功融合了RAG的高效检索能力和QFS的全局理解能力,适用于大规模私有语料中的复杂问答任务。
1 Introduction
本文介绍了GraphRAG,这是一种基于图结构的检索增强生成(RAG)方法,旨在解决传统RAG方法在处理需要全局理解的“情境构建”(sensemaking)查询方面的局限性。
传统RAG方法,也称为“向量RAG”,通过从外部语料库中检索与查询相关的文本片段,并将其输入大型语言模型(LLM)生成回答。这种方法适合于只需少量文本信息即可回答的查询,但无法处理需要理解整个数据集的全局趋势或复杂主题的查询,例如“过去十年中跨学科研究如何影响科学发现的趋势”。
为了解决这一问题,GraphRAG提出了一种新的方法框架:
知识图谱构建:使用LLM从文本中提取关键实体和它们之间的关系,构建知识图谱。
社区划分与层级化:将图谱划分为多个层次化的紧密关联实体社区。
社区摘要生成:自底向上地为每个社区生成摘要,高层摘要融合低层摘要,从而形成全局描述。
查询处理:通过“映射-归约”(map-reduce)方式,使用社区摘要生成部分回答,并最终整合为一个全局回答。
为了验证GraphRAG的效果,作者提出了一种基于LLM的评估方法:首先使用一个LLM生成针对语料库的全局问题,再使用另一个LLM根据预定义标准评估不同RAG系统的回答质量。实验结果表明,GraphRAG在使用GPT-4作为LLM时,显著优于传统的向量RAG方法。
最后,作者提到GraphRAG已开源,并集成到多个主流自然语言处理库中,如LangChain、LlamaIndex、NebulaGraph和Neo4J,方便开发者使用和扩展。
2 Background
本章回顾了与RAG(Retrieval-Augmented Generation)系统和相关技术相关的背景知识,重点介绍GraphRAG与其他方法的区别、知识图谱在RAG中的应用、自适应基准测试方法以及RAG系统的评估标准。
2.1 RAG方法与系统
RAG是一种通过从外部数据源检索相关信息,并将这些信息结合到大型语言模型(LLM)生成的回答中的系统。当数据源的大小超出LLM的上下文窗口时,RAG特别有用。传统RAG方法通常通过文本嵌入(text embeddings)从向量空间中检索语义相似的内容,这种方法被称为“向量RAG”。GraphRAG则不同,它通过构建图索引,并利用图的模块化结构进行主题划分,从而实现对整个数据集的全局理解。GraphRAG借鉴了用于生成摘要并进行迭代聚合的先进RAG策略,并通过图社区检测提取主题模块。
2.2 知识图谱在LLM与RAG中的应用
从自然语言文本中提取知识图谱的方法包括规则匹配、统计模式识别、聚类和嵌入技术。GraphRAG属于使用LLM进行知识图谱提取的新兴研究方向。它还与发展基于知识图谱的RAG索引的方法相关。与现有方法不同的是,GraphRAG利用图的模块化特性,通过递归生成不同层级的摘要来增强全局理解能力。
2.3 自适应基准测试
现有的开放域问答基准(如HotPotQA、MultiHop-RAG)主要评估向量RAG的性能。本文提出了一种用于评估全局理解能力的自适应基准方法,通过生成覆盖整个语料库的问题来测试系统对整体内容的理解。该方法借鉴了基于LLM的虚拟人物生成技术,生成与真实使用场景相符的问题,从而更公平地测试RAG系统在全局感知任务中的表现。
2.4 RAG评估标准
在评估方面,本文采用LLM作为评价者,根据其生成回答的质量进行评分。传统评估标准如“上下文相关性”、“忠实性”等适用于向量RAG,但不适合评估全局感知任务。为此,本文设计了适用于全局理解问题的评估标准,并通过对比不同模型的回答进行相对性能评估。此外,还通过从LLM中提取可验证的事实声明进行进一步验证。
总结:
本章详细介绍了RAG系统的背景、GraphRAG的创新之处、知识图谱在RAG中的作用、自适应基准测试方法及其评估标准,为后续的实验设计和性能评估奠定了理论基础。
3 Methods
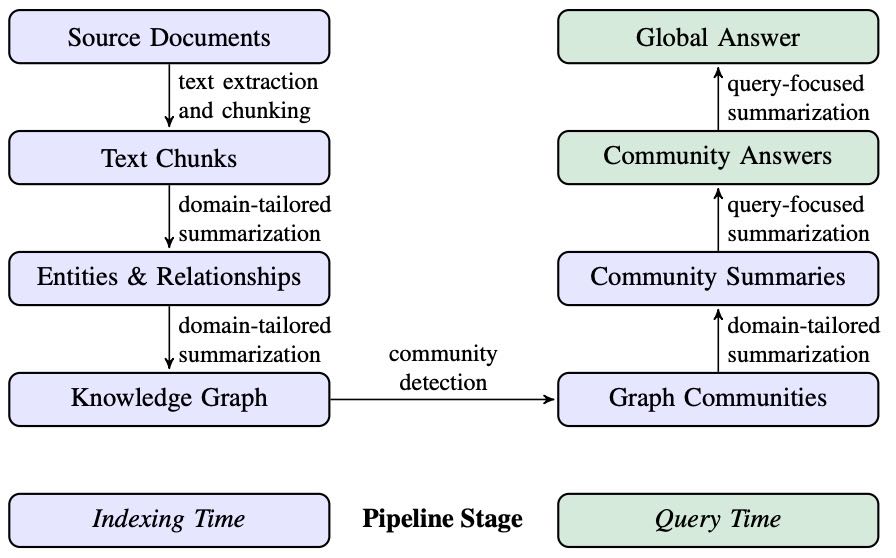
Figure 1: Graph RAG pipeline using an LLM-derived graph index of source document text. This graph index spans nodes (e.g., entities), edges (e.g., relationships), and covariates (e.g., claims) that have been detected, extracted, and summarized by LLM prompts tailored to the domain of the dataset. Community detection (e.g., Leiden, Traag et al.,, 2019) is used to partition the graph index into groups of elements (nodes, edges, covariates) that the LLM can summarize in parallel at both indexing time and query time. The “global answer” to a given query is produced using a final round of query-focused summarization over all community summaries reporting relevance to that query.
本章节介绍了GraphRAG方法的流程和评估标准,主要包括以下几个方面的内容:
3.1 GraphRAG 工作流程
该部分描述了GraphRAG方法从原始文档到最终答案的处理流程,分为多个阶段:
源文档 → 文本块
将文档拆分为文本块,LLM从每个块中提取信息。
文本块大小是关键设计参数:更长的块减少调用次数但可能影响信息召回。
文本块 → 实体与关系
LLM提取每个文本块中的实体和关系,并生成描述。
可通过**上下文学习(in-context learning)**定制提取提示,适应特定领域。
同时可提取声明(claims),即关于实体的事实性陈述。
实体与关系 → 知识图谱
提取的实体、关系和声明形成知识图谱,包含节点、边和协变量。
多次提取同一实体或关系会进行合并与聚合,重复次数作为边权重。
当前采用精确字符串匹配进行实体匹配,但也支持更软的匹配方式。
示例:
节点: 张三
边: 就读于
节点: 北京大学
协变量: 起始时间 = 2010年,专业 = 计算机
知识图谱 → 图社区
使用Leiden社区检测算法对图进行分层划分,形成多个子社区。
每个层级的社区划分可用于分治式全局摘要。
图社区 → 社区摘要
生成每个社区的摘要,用于后续的全局问题回答。
摘要通过聚合节点、边和声明的描述生成,根据上下文窗口大小进行优先级排序或替换。
社区摘要 → 社区答案 → 全局答案
用户查询通过多阶段处理生成最终答案。
包括:社区摘要的准备、映射生成中间答案、按相关性排序后生成最终答案。
答案生成过程考虑了上下文窗口的限制,确保信息覆盖全面。
3.2 全局理解问题生成
为评估RAG系统在全局理解任务中的表现,使用LLM生成一组与数据集相关的高层问题,而非依赖于具体细节的低层事实。
生成步骤:
根据数据集描述生成K个用户角色(Personas)。
每个用户生成N个任务。
每个用户-任务组合生成M个问题,要求:
覆盖整个数据集。
不涉及具体细节。
评估配置:设置K = M = N = 5,共125个问题/数据集。
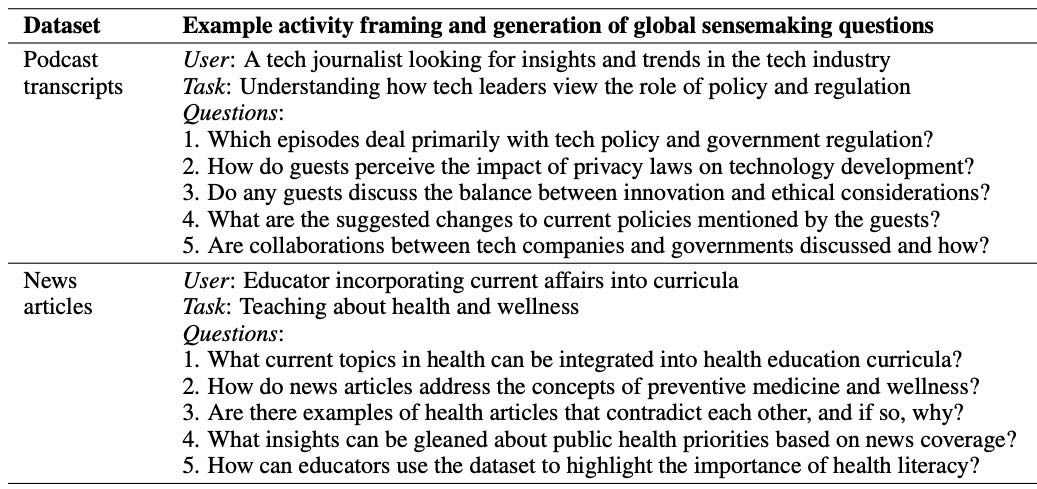
Table 1: Examples of potential users, tasks, and questions generated by the LLM based on short descriptions of the target datasets. Questions target global understanding rather than specific details.
3.3 全局理解评估标准
由于缺乏标准答案,采用LLM对比评估方法,从四个维度评估不同方法的回答质量:
综合性(Comprehensiveness):回答是否覆盖了问题的各个方面和细节。
多样性(Diversity):回答是否提供了不同的视角和洞察。
赋能性(Empowerment):回答是否帮助用户形成判断。
直接性(Directness)(控制变量):回答是否直接、清晰地回答了问题。
评估方法:
LLM被提供问题和两个系统的回答,根据上述标准进行比较。
多次重复比较并取平均结果。
由于直接性与综合性和多样性存在冲突,预期没有方法能在所有四个标准中都胜出。
总结
本章详细介绍了GraphRAG的工作流程,包括从文本块提取实体关系、构建知识图谱、社区划分与摘要生成,以及最终的全局答案生成机制。同时,提出了用于评估全局理解任务的问题生成方法和多维度的LLM对比评估标准,为后续实验和比较奠定了方法论基础。
4 Analysis
本章节“4 Analysis”主要介绍了两项实验的设计与方法,用于评估不同条件在查询聚焦摘要(Query-Focused Summarization)任务中的表现。
4.1 实验1
4.1.1 数据集
实验使用了两个总token数在百万量级的真实场景数据集:
播客转录文本:来自微软CTO Kevin Scott主持的播客《Behind the Tech with Kevin Scott》,内容涉及科技与科学领域对话,共约100万token,分为1669个chunk,每个 chunk 有600个token块,重叠100 token。
新闻文章:涵盖娱乐、商业、体育、科技、健康和科学等类别的新闻数据,时间跨度为2013年9月至2023年12月,共约170万token,分为3197个chunk,每个 chunk 有600个token块,重叠100 token。
4.1.2 实验条件
对比了六种方法:
GraphRAG 在四个不同图社区层级(C0至C3)下的表现,不同层级使用不同粒度的社区摘要回答问题。
C0. Uses root-level community summaries (fewest in number) to answer user queries.
C1. Uses high-level community summaries to answer queries.
C2. Uses intermediate-level community summaries to answer queries
C3. Uses low-level community summaries (greatest in number) to answer queries
TS(文本摘要):不使用图结构,直接对原文本进行shuffled and chunked,以方便进行 map-reduce 提取摘要。
SS(向量RAG):基于语义搜索的向量检索方法,将文本块加入上下文直到达到token限制。
所有方法使用相同的上下文窗口大小和生成答案的提示模板,仅在上下文内容的构建方式上存在差异。图索引的构建使用了通用的实体和关系提取提示,并根据数据领域定制了实体类型和示例。
4.1.3 实验配置
使用固定8k token的上下文窗口。
对于播客数据集的图索引构建,使用600-token窗口,耗时281分钟,运行在一台16GB RAM的虚拟机上,并通过OpenAI的gpt-4-turbo接口(2M TPM,10k RPM)处理。
使用 graspologic 库中的 Leiden 算法进行社区检测。
系统提示和评估提示分别在附录E和F中提供,统计分析在附录G中。
4.2 实验2
为验证实验1中“全面性”和“多样性”的评估结果,进行了基于**事实声明(factual claims)**的分析。
方法:
采用 Claimify 方法,从每个答案中提取包含至少一个事实声明的句子,并将其拆解为独立的事实声明。
从实验1中所有答案中提取了47,075个唯一声明,平均每个答案提取31个声明。
评估指标:
全面性(Comprehensiveness):每个条件下生成的答案中提取到的声明数的平均值。
多样性(Diversity):通过聚类分析每个答案中的声明数量。使用 Agglomerative Clustering(完全连接方式),距离度量为 \(1 - \text{ROUGE-L}\)。报告了在不同距离阈值下的结果。
总结
本章通过两组实验,系统评估了不同方法在生成查询聚焦摘要任务中的表现。实验1对比了 GraphRAG、TS 和 SS 方法的上下文构建方式和效果,实验2进一步通过事实声明的提取与聚类分析,验证了生成内容的全面性与多样性。这些实验为后续结果分析和对比奠定了基础。
5 Results
本章节主要总结了论文中的实验结果,主要围绕两个实验展开,评估了GraphRAG方法在查询聚焦摘要任务中的性能表现。以下是具体总结:
5.1 实验一:不同方法在摘要任务中的表现比较
图构建与摘要层次
图结构:
对Podcast数据集构建了包含8,564个节点和20,691条边的图
对News数据集构建了包含15,754个节点和19,520条边的图
社区摘要:
展示了不同层级(C0-C3)的社区摘要数量
根层级(C0)的摘要所需上下文token数远少于底层(C3)和传统文本摘要(TS),分别减少了9-43倍的token使用量
性能比较
GraphRAG vs. RAG (SS):
在全面性(Comprehensiveness)和多样性(Diversity)两个指标上,GraphRAG在两种数据集上都显著优于RAG。
Podcast数据集中,GraphRAG的全面性胜率达到了72%-83%,多样性达到了75%-82%;News数据集中,全面性为72%-80%,多样性为62%-71%。
直接性(Directness)方面,RAG生成的回答更直接。
GraphRAG vs. TS(源文本摘要):
中间层和低层的社区摘要在全面性和多样性上略优于TS,尤其在News数据集中表现更突出。
C3层级(低层)的GraphRAG在News中全面性胜率达64%(p<.001),多样性胜率达60%(p<.001)。
C0(根层)虽然性能稍弱,但token使用量大大减少,适合需要高效迭代回答的任务(如探索性问答)。
Empowerment分析:
结果显示略显混合,表明GraphRAG在帮助用户理解方面仍需提升,尤其是在提供具体例子、引用和引文方面。
优化元素提取提示可能有助于保留更多细节。
5.2 实验二:基于声明的指标评估
声明数量(Comprehensiveness)
表3显示:所有GraphRAG条件(C0-C3)和TS在声明数量上都显著高于RAG(SS),p值均低于0.05。
在两个数据集中,C0的声明数量最高,表明根层级摘要最具全面性。
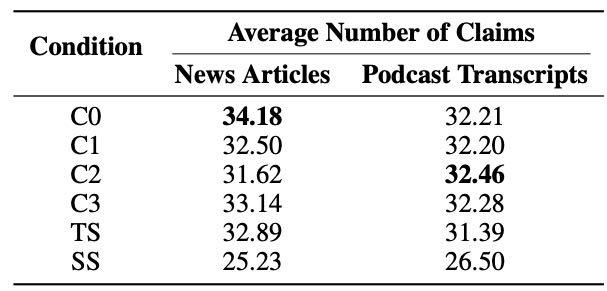
Table 3: Average number of extracted claims, reported by condition and dataset type. Bolded values represent the highest score in each column.
簇数量(Diversity)
表4显示:在Podcast数据集中,所有GraphRAG条件在不同距离阈值下都显著优于SS;在News数据集中,只有C0在所有距离阈值下显著优于SS,C1-C3在部分距离阈值下表现较好。
与实验一的结果一致,GraphRAG在多样性方面普遍优于RAG,尤其是在Podcast数据集中。
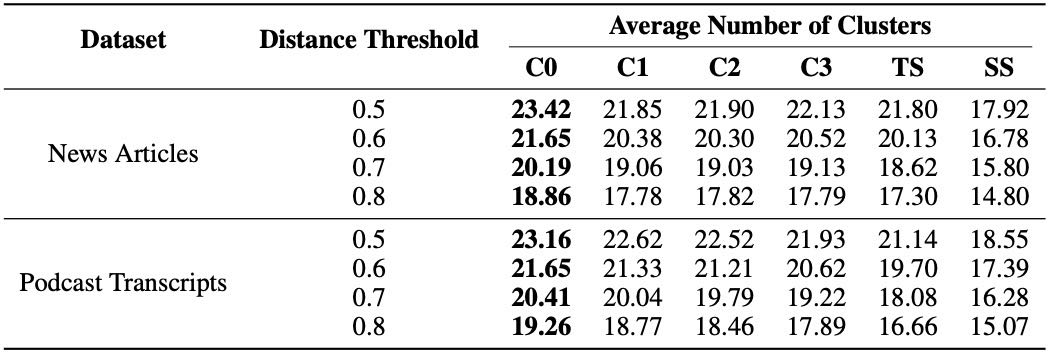
Table 4: Average number of clusters across different distance thresholds, reported by condition and dataset type. Bolded values represent the highest score in each row.
对比一致性分析
实验一中使用LLM判断的胜者与实验二基于声明的指标结果进行了对比。
在78%的全面性比较和69-70%的多样性比较中,LLM判断与声明指标结果一致,说明两者具有中等偏强的一致性。
总结
GraphRAG的优势:
在全面性和多样性上显著优于传统RAG(SS)
在资源消耗方面(token使用)优于源文本摘要(TS)
根层级(C0)适合高效迭代问答任务
局限性:
在直接性方面不如RAG
Empowerment指标表现较弱,需优化提取策略
结论:
GraphRAG提供了一种从局部到全局的信息检索和摘要方法,在大规模数据集上表现出良好的性能和效率
与其他方法的比较表明,GraphRAG在多维评估中具有竞争力,尤其适用于需要结构化和多样性输出的查询任务
6 Discussion
本章讨论了当前研究的局限性与未来工作方向,并分析了其潜在影响。
6.1 评估方法的局限性
目前的评估主要集中在两个约含一百万词的语料库上,针对的是特定的推理问题。为了更全面地了解系统的性能,需要进一步研究其在不同领域和不同使用场景下的泛化能力。此外,通过比较生成内容的编造率(如使用 SelfCheckGPT 等方法)可以增强当前分析的可靠性。
6.2 未来工作
GraphRAG 方法依赖于图索引、丰富的文本注释和分层社区结构,为系统的优化和适应性提供了多种可能性。未来的工作方向包括:
探索基于嵌入匹配的局部检索方法,以提高查询与图注释的匹配效率;
结合嵌入匹配与即时社区报告生成的混合 RAG 模式;
将“汇总(roll-up)”方法扩展到社区结构的多个层级;
实现一种“深入探索(drill down)”机制,根据高层级摘要中的线索进一步挖掘信息。
更广泛的影响
作为对大规模文档集合进行问答的工具,如果生成的回答不能准确反映源数据,可能会对后续的理解和决策任务带来风险。因此,系统使用时应明确说明人工智能的使用及其输出中可能存在的错误。与传统向量 RAG 相比,GraphRAG 在回答全局性问题方面展现出减少此类风险的潜力,避免了仅依赖局部检索事实作为全局摘要的风险。
7 Conclusion
本章总结了文章提出的GraphRAG方法,这是一种结合知识图谱生成与查询聚焦摘要(QFS)的RAG方法,旨在支持用户在大规模文本语料库中进行有效的信息理解和分析。初步评估表明,GraphRAG在答案的全面性和多样性方面显著优于基于向量的RAG基线方法,并且与使用map-reduce进行全局摘要的无图方法相比也具有竞争力。对于需要在同一数据集上进行大量全局查询的场景,基于实体图索引的根级社区摘要提供了一种数据索引方式,其性能优于向量RAG,且在较低的token成本下达到与其他全局方法相当的表现。
Appendix A Entity and Relationship Extraction Approach
本章节主要介绍了图谱抽取(GraphRAG)方法中用于实体和关系抽取的实现方法,重点包括以下内容:
1. 实体与关系抽取方法
使用多部分大语言模型(LLM)提示,首先从文本中识别出所有实体,包括实体的名称、类型和描述,然后识别出明确相关的实体之间的关系,包括源实体、目标实体以及关系描述。
抽取结果以分隔符分隔的元组列表形式输出。
2. 自我反思(Self-Reflection)技术
提示工程(Prompt Engineering)对知识图谱抽取质量有显著影响,不同方法在计算成本(token消耗)上也有差异。
自我反思是一种提示工程技术,通过让LLM生成答案后,再评估其正确性、清晰度和完整性,并基于评估结果生成改进的回答。
作者在知识图谱抽取中应用了该技术,并研究了移除自我反思对性能和成本的影响。
3. 分块大小与抽取效果的关系
使用**较大的分块(chunk size)**在LLM调用次数上更节省成本。
但较大的分块可能导致实体抽取数量减少。例如,在HotPotQA数据集上,当分块大小从600 token增加到2400 token时,GPT-4提取的实体数量减少近一半。
为了解决这一问题,作者引入了自我反思的提示策略,在初步抽取后,再次让LLM检查是否遗漏了实体,并鼓励其补充遗漏内容。
该过程分为多个阶段:首先让LLM判断是否遗漏实体(使用logit偏置迫使二选一决策),如果判断遗漏,则通过提示信息鼓励LLM检测并补充缺失的实体。
该方法能够在使用较大分块的情况下,不降低抽取质量,同时避免引入噪声。
作者设定了最大迭代次数,控制自我反思的执行次数。
4. 实验结果(图3)
图3展示了在HotPotQA数据集上,使用不同分块大小(600、1200、2400 token)和不同自我反思迭代次数时,实体引用数量的变化情况。
实验使用了GPT-4-Turbo和通用实体抽取提示。
表明:随着自我反思次数的增加,即使在较大的分块下,也能显著提升实体抽取数量。
总结
本节详细介绍了GraphRAG中实体与关系抽取的方法,尤其是通过自我反思机制,弥补了大分块带来的信息遗漏问题。该方法在保持高质量抽取结果的同时,降低了调用成本,并提供了对不同分块大小和提示策略的系统比较和评估。
Appendix B Example Community Detection
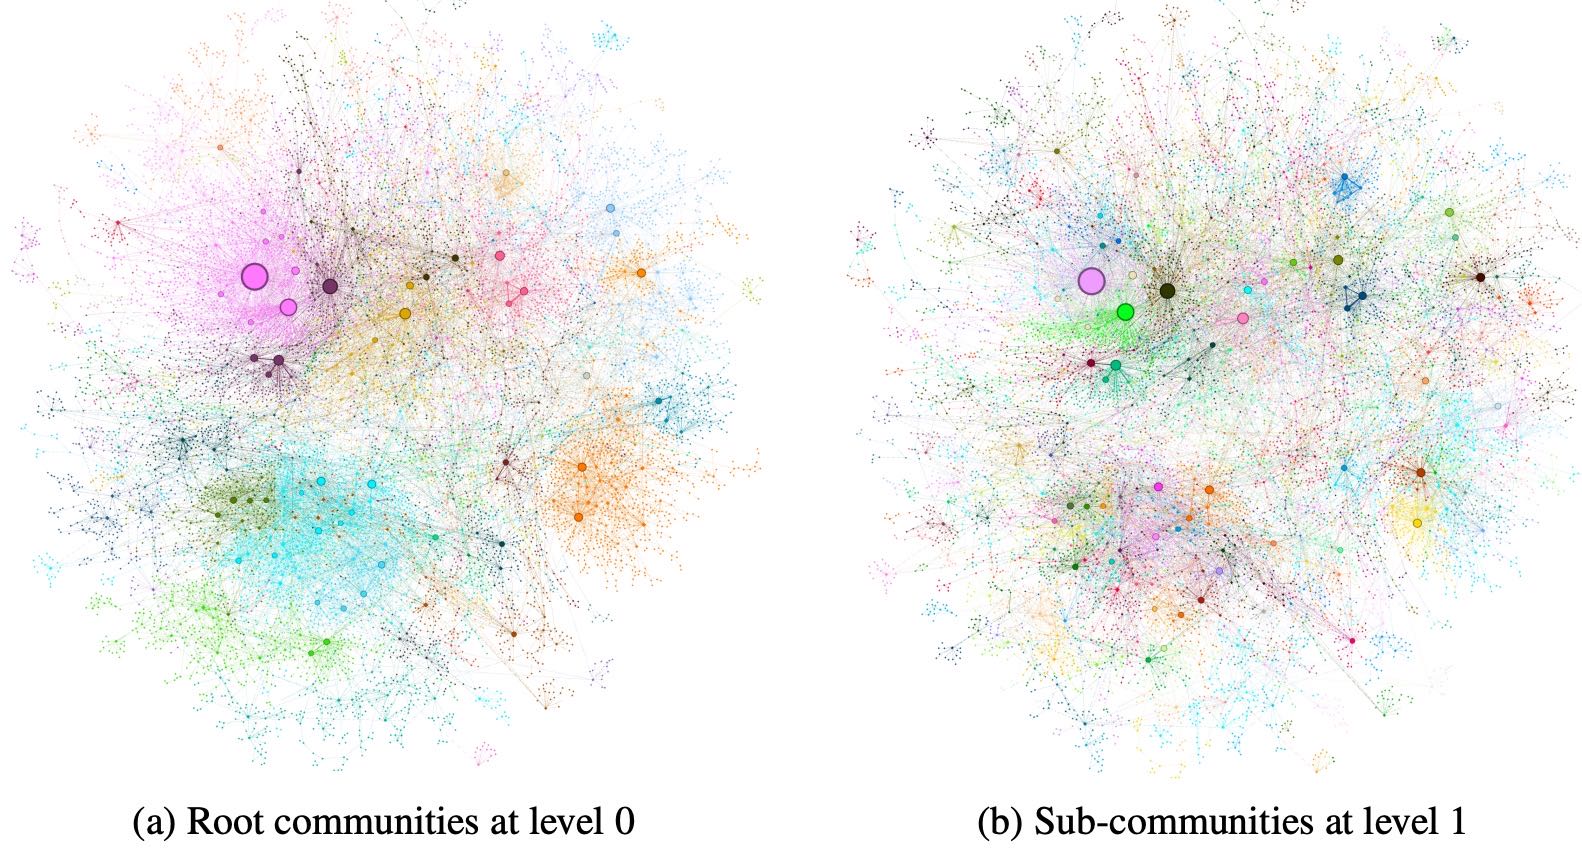
Figure 4:Graph communities detected using the Leiden algorithm (Traag et al.,, 2019) over the MultiHop-RAG (Tang and Yang,, 2024) dataset as indexed. Circles represent entity nodes with size proportional to their degree. Node layout was performed via OpenORD (Martin et al.,, 2011) and Force Atlas 2 (Jacomy et al.,, 2014). Node colors represent entity communities, shown at two levels of hierarchical clustering: (a) Level 0, corresponding to the hierarchical partition with maximum modularity, and (b) Level 1, which reveals internal structure within these root-level communities.
本附录展示了使用 Leiden 算法在 MultiHop-RAG 数据集上检测图社区的结果。图 4 展示了两个层级的社区结构:(a) 层级 0 表示具有最大模块度的根级社区划分;(b) 层级 1 则进一步揭示了根级社区内的子结构。图中圆形节点代表实体,其大小与节点度成正比,布局由 OpenORD 和 Force Atlas 2 算法生成,节点颜色表示社区归属。
Appendix C Context Window Selection
本节研究了上下文窗口大小对模型表现的影响,特别是针对具有大上下文容量的模型(如 gpt-4-turbo,最大支持 128k tokens)。由于较长上下文可能导致信息“中间丢失”(Liu et al., 2023;Kuratov et al., 2024),作者测试了四种不同的上下文窗口大小(8k、16k、32k 和 64k tokens),以确定在不同数据集、问题和评估指标下的最佳设置。
研究结果显示,最小的 8k 上下文窗口在全面性(平均胜率 58.1%)上表现最佳,而在多样性和赋能性方面(平均胜率分别为 52.4% 和 51.3%)也与较大窗口表现相近。由于实验更重视答案的全面性和多样性,最终决定在所有评估中统一使用 8k tokens 的上下文窗口。
Appendix D Example Answer Comparison

Table 5: Example question, answers, and LLM-generated assessments for the News article dataset.
本章节(附录 D 例题答案比较)通过一个具体问题和两种不同方法(Graph RAG 和 Naïve RAG)生成的答案,比较它们在“全面性”、“多样性”、“赋能性”和“直接性”四个维度上的表现。
问题:哪些公众人物在各类娱乐文章中被频繁提及?
Graph RAG 的回答:
提供了更广泛和详细的信息,涵盖了电影、电视、音乐、体育、游戏和数字媒体等多个娱乐领域。
提到了不同领域的代表性人物,并说明了他们的贡献及其对各自领域的影响。
包括了争议事件,并强调了这些人物在文化和社会讨论中的重要性。
信息结构完整,但内容较泛,不够聚焦。
Naïve RAG 的回答:
回答更具体,列举了 Taylor Swift、Travis Kelce、Britney Spears 和 Justin Timberlake 等几位公众人物。
主要关注他们的个人生活和职业生涯,并解释了他们为何受到媒体关注。
内容简洁直接,但覆盖范围较窄,主要集中在音乐和体育领域。
LLM 的评估:
全面性(Comprehensiveness):Graph RAG 胜出,因为它覆盖了更多娱乐行业领域,并提供了更详细的信息。
多样性(Diversity):Graph RAG 胜出,因为涉及的领域和人物更广泛,支持信息来源也更丰富。
赋能性(Empowerment):Graph RAG 胜出,因为它提供了更结构化的信息,帮助读者更全面理解问题。
直接性(Directness):Naïve RAG 胜出,因为它直接回答了问题,列举了具体的公众人物并给出简明解释。
总结:Graph RAG 在全面性、多样性和赋能性方面表现更优,而 Naïve RAG 在直接回答问题方面更胜一筹。两者各有优势,具体应用场景可依据需求选择。
Appendix E System Prompts
E.1 实体实例生成(Element Instance Generation)
英文版
---Goal---
Given a text document that is potentially relevant to this activity and a list of entity types, identify all entities of those types from the text and all relationships among the identified entities.

---Steps---
1. Identify all entities. For each identified entity, extract the following information:
- entity_name: Name of the entity, capitalized
- entity_type: One of the following types: [{entity_types}]
- entity_description: Comprehensive description of the entity’s attributes and activities

Format each entity as ("entity"{tuple_delimiter}<entity_name>{tuple_delimiter}<entity_type>{tuple_
delimiter}<entity_description>

2. From the entities identified in step 1, identify all pairs of (source_entity, target_entity) that are \*clearly related\* to each other
For each pair of related entities, extract the following information:
- source_entity: name of the source entity, as identified in step 1
- target_entity: name of the target entity, as identified in step 1
- relationship_description: explanation as to why you think the source entity and the target entity are related to each other
- relationship_strength: a numeric score indicating strength of the relationship between the source entity and target entity

Format each relationship as ("relationship"{tuple_delimiter}<source_entity>{tuple_delimiter}<target_
entity>{tuple_delimiter}<relationship_description>{tuple_delimiter}<relationship_strength>)

3. Return output in English as a single list of all the entities and relationships identified in steps 1 and 2. Use \*\*{record_delimiter}\*\* as the list delimiter.

4. When finished, output {completion_delimiter}

---Examples---

Entity_types: ORGANIZATION,PERSON

Input:

The Fed is scheduled to meet on Tuesday and Wednesday, with the central bank planning to release its latest policy decision on Wednesday at 2:00 p.m. ET, followed by a press conference where Fed Chair Jerome Powell will take questions. Investors expect the Federal Open Market Committee to hold its benchmark interest rate steady in a range of 5.25%-5.5%.

Output:

("entity"{tuple_delimiter}FED{tuple_delimiter}ORGANIZATION{tuple_delimiter}The Fed is the Federal Reserve, which is setting interest rates on Tuesday and Wednesday)
{record_delimiter}
("entity"{tuple_delimiter}JEROME POWELL{tuple_delimiter}PERSON{tuple_delimiter}Jerome Powell is the chair of the Federal Reserve)
{record_delimiter}
("entity"{tuple_delimiter}FEDERAL OPEN MARKET COMMITTEE{tuple_delimiter}ORGANIZATION{tuple_delimiter}The Federal Reserve committee makes key decisions about interest rates and the growth of the United States money supply)
{record_delimiter}
("relationship"{tuple_delimiter}JEROME POWELL{tuple_delimiter}FED{tuple_delimiter}Jerome Powell is the Chair of the Federal Reserve and will answer questions at a press conference{tuple_delimiter}9)
{completion_delimiter}

…More examples…

---Real Data---

Entity_types: {entity_types}
Input:

{input_text}

Output:
中文版
---目标---
给定一段与某个任务可能相关的文本内容,以及一个实体类型列表,请从文本中识别出所有属于这些类型的实体,并识别这些实体之间的所有关系。

---步骤---

1. 识别所有实体。对于每一个识别出的实体,提取以下信息:
- entity_name:实体名称,首字母大写
- entity_type:实体类型,必须是以下类型之一:[{entity_types}]
- entity_description:对该实体的属性和活动的全面描述

请用以下格式输出每个实体:
("entity"{tuple_delimiter}<entity_name>{tuple_delimiter}<entity_type>{tuple_delimiter}<entity_description>)

2. 从步骤1中识别出的实体中,识别所有明确存在关系的实体对(source_entity, target_entity)。
对于每一对存在关系的实体,提取以下信息:
- source_entity:关系的源实体名称,来自步骤1
- target_entity:关系的目标实体名称,来自步骤1
- relationship_description:说明为何认为这两个实体之间存在关系
- relationship_strength:表示关系强度的数字评分

请用以下格式输出每条关系:
("relationship"{tuple_delimiter}<source_entity>{tuple_delimiter}<target_entity>{tuple_delimiter}<relationship_description>{tuple_delimiter}<relationship_strength>)

3. 将步骤1和2中识别出的所有实体和关系按以下方式统一输出为一个列表。请使用 **{record_delimiter}** 作为记录之间的分隔符。

4. 完成后,请输出 {completion_delimiter}

---示例---

Entity_types: ORGANIZATION,PERSON

输入:

美联储(Fed)计划于周二和周三召开会议,该央行将于周三下午2点(美东时间)公布最新的政策决定,随后美联储主席杰罗姆·鲍威尔(JEROME POWELL)将出席新闻发布会并回答提问。投资者预计联邦公开市场委员会(FEDERAL OPEN MARKET COMMITTEE)将维持其基准利率在5.25%-5.5%的范围内不变。

输出:

("entity"{tuple_delimiter}FED{tuple_delimiter}ORGANIZATION{tuple_delimiter}美联储(Fed)是the Federal Reserve, ,美联储在周二和周三设定利率)
{record_delimiter}
("entity"{tuple_delimiter}JEROME POWELL{tuple_delimiter}PERSON{tuple_delimiter}杰罗姆·鲍威尔(JEROME POWELL)是美联储主席)
{record_delimiter}
("entity"{tuple_delimiter}FEDERAL OPEN MARKET COMMITTEE{tuple_delimiter}ORGANIZATION{tuple_delimiter}美联储委员会(FEDERAL OPEN MARKET COMMITTEE)就利率和美国货币供应量的增长做出关键决定)
{record_delimiter}
("relationship"{tuple_delimiter}JEROME POWELL{tuple_delimiter}FED{tuple_delimiter}杰罗姆·鲍威尔(JEROME POWELL)是美联储主席,他将在新闻发布会上回答问题{tuple_delimiter}9)
{completion_delimiter}

---真实数据---

Entity_types: {entity_types}
输入:

{input_text}

输出:
E.2 社区摘要生成(Community Summary Generation)
英文版
---Role---
You are an AI assistant that helps a human analyst to perform general information discovery.
Information discovery is the process of identifying and assessing relevant information associated with certain entities (e.g., organizations and individuals) within a network.

---Goal---
Write a comprehensive report of a community, given a list of entities that belong to the community as well as their relationships and optional associated claims.
The report will be used to inform decision-makers about information associated with the community and their potential impact.
The content of this report includes an overview of the community’s key entities, their legal compliance, technical capabilities, reputation, and noteworthy claims.

---Report Structure---
The report should include the following sections:
- TITLE: community’s name that represents its key entities - title should be short but specific. When possible, include representative named entities in the title.
- SUMMARY: An executive summary of the community’s overall structure, how its entities are related to each other, and significant information associated with its entities.
- IMPACT SEVERITY RATING: a float score between 0-10 that represents the severity of IMPACT posed by entities within the community. IMPACT is the scored importance of a community.
- RATING EXPLANATION: Give a single sentence explanation of the IMPACT severity rating.
- DETAILED FINDINGS: A list of 5-10 key insights about the community. Each insight should have a short summary followed by multiple paragraphs of explanatory text grounded according to the grounding rules below. Be comprehensive.

Return output as a well-formed JSON-formatted string with the following format:
{{
"title": <report_title>,
"summary": <executive_summary>,
"rating": <impact_severity_rating>,
"rating_explanation": <rating_explanation>,
"findings": [
{{
"summary":<insight_1_summary>,
"explanation": <insight_1_explanation>
}},
{{
"summary":<insight_2_summary>,
"explanation": <insight_2_explanation>
}}
]
}}

---Grounding Rules---

Points supported by data should list their data references as follows:
"This is an example sentence supported by multiple data references [Data: <dataset name> (record ids); <dataset name> (record ids)]."
Do not list more than 5 record ids in a single reference. Instead, list the top 5 most relevant record ids and add "+more" to indicate that there are more.

For example:
"Person X is the owner of Company Y and subject to many allegations of wrongdoing [Data: Reports (1), Entities (5, 7); Relationships (23); Claims (7, 2, 34, 64, 46, +more)]."
where 1, 5, 7, 23, 2, 34, 46, and 64 represent the id (not the index) of the relevant data record.
Do not include information where the supporting evidence for it is not provided.

---Example---

Input:

Entities

id,entity,description
5,VERDANT OASIS PLAZA,Verdant Oasis Plaza is the location of the Unity March
6,HARMONY ASSEMBLY,Harmony Assembly is an organization that is holding a march at Verdant Oasis Plaza

Relationships

id,source,target,description
37,VERDANT OASIS PLAZA,UNITY MARCH,Verdant Oasis Plaza is the location of the Unity March
38,VERDANT OASIS PLAZA,HARMONY ASSEMBLY,Harmony Assembly is holding a march at Verdant Oasis Plaza
39,VERDANT OASIS PLAZA,UNITY MARCH,The Unity March is taking place at Verdant Oasis Plaza
40,VERDANT OASIS PLAZA,TRIBUNE SPOTLIGHT,Tribune Spotlight is reporting on the Unity march taking place at Verdant Oasis Plaza
41,VERDANT OASIS PLAZA,BAILEY ASADI,Bailey Asadi is speaking at Verdant Oasis Plaza about the march
43,HARMONY ASSEMBLY,UNITY MARCH,Harmony Assembly is organizing the Unity March

Output:
{{
"title": "Verdant Oasis Plaza and Unity March",
"summary": "The community revolves around the Verdant Oasis Plaza, which is the location of the Unity March. The plaza has relationships with the Harmony Assembly, Unity March, and Tribune Spotlight, all of which are associated with the march event.",
"rating": 5.0,
"rating_explanation": "The impact severity rating is moderate due to the potential for unrest or conflict during the Unity March.",
"findings": [
{{
"summary": "Verdant Oasis Plaza as the central location",
"explanation": "Verdant Oasis Plaza is the central entity in this community, serving as the location for the Unity March. This plaza is the common link between all other entities, suggesting its significance in the community. The plaza’s association with the march could potentially lead to issues such as public disorder or conflict, depending on the nature of the march and the reactions it provokes. [Data: Entities (5), Relationships (37, 38, 39, 40, 41,+more)]"
}},
{{
"summary": "Harmony Assembly’s role in the community",
"explanation": "Harmony Assembly is another key entity in this community, being the organizer of the march at Verdant Oasis Plaza. The nature of Harmony Assembly and its march could be a potential source of threat, depending on their objectives and the reactions they provoke. The relationship between Harmony Assembly and the plaza is crucial in understanding the dynamics of this community. [Data: Entities(6), Relationships (38, 43)]"
}},
{{
"summary": "Unity March as a significant event",
"explanation": "The Unity March is a significant event taking place at Verdant Oasis Plaza. This event is a key factor in the community’s dynamics and could be a potential source of threat, depending on the nature of the march and the reactions it provokes. The relationship between the march and the plaza is crucial in understanding the dynamics of this community. [Data: Relationships (39)]"
}},
{{
"summary": "Role of Tribune Spotlight",
"explanation": "Tribune Spotlight is reporting on the Unity March taking place in Verdant Oasis Plaza. This suggests that the event has attracted media attention, which could amplify its impact on the community. The role of Tribune Spotlight could be significant in shaping public perception of the event and the entities involved. [Data: Relationships (40)]"
}}
]
}}

---Real Data---

Use the following text for your answer. Do not make anything up in your answer.

Input:

{input_text}

…Report Structure and Grounding Rules Repeated…

Output:
中文版
---角色定义---
你是一个 AI 助理,负责协助人类分析师进行一般性信息发现任务。
信息发现是指识别并评估与某个网络中的特定实体(如组织或个人)相关的关键信息的过程。

---目标---
在给定一个社区内的实体列表,以及它们之间的关系和可选的相关声明(claims)的前提下,撰写一份该社区的综合报告。
该报告将用于向决策者传达社区内实体相关的重要信息及其潜在影响。
报告内容应包括:社区关键实体概述、法律合规情况、技术能力、声誉以及值得关注的声明等方面。

---报告结构---
报告应包括以下几个部分:
- **标题 (TITLE)**:社区名称,应能代表其关键实体,简短但具体。如有可能,标题中应包含具代表性的命名实体。
- **概要 (SUMMARY)**:对社区整体结构的执行摘要,描述其实体如何相互关联,以及与这些实体相关的重大信息。
- **影响严重程度评分 (IMPACT SEVERITY RATING)**:一个介于 0-10 之间的浮点数,用以表示社区中实体带来的影响程度(IMPACT)。IMPACT 指的是社区的重要性评分。
- **评分解释 (RATING EXPLANATION)**:一句话解释影响评分的理由。
- **详细发现 (DETAILED FINDINGS)**:列出 5-10 条关于该社区的重要洞见。每条洞见应包含一个简要摘要,并附有多段说明文字,并依据如下溯源规则提供支持证据。内容应具有全面性。

以 JSON 字符串格式返回结果,格式如下:
{{
"title": <报告标题>,
"summary": <执行摘要>,
"rating": <影响严重程度评分>,
"rating_explanation": <评分解释>,
"findings": [
{{
"summary": <洞见1简述>,
"explanation": <洞见1详细解释>
}},
{{
"summary": <洞见2简述>,
"explanation": <洞见2详细解释>
}}
]
}}

---溯源规则(Grounding Rules)---

被数据支持的陈述必须列出其数据来源,格式如下:
“这是一个由多个数据源支持的示例句子 [数据来源: <数据集名称> (记录ID); <数据集名称> (记录ID)]。”

每个引用中不得列出超过5个记录ID。如超过5个,请列出前5个最相关的ID,并加上“+more”表示还有更多记录。

例如:
“X先生是Y公司的所有人,并涉及多起不当行为指控 [数据来源: Reports (1), Entities (5, 7); Relationships (23); Claims (7, 2, 34, 64, 46, +more)]。”
其中1、5、7、23、2、34、46 和 64 为相关数据记录的 ID(不是索引)。

不得引用无证据支持的信息。

---示例---

输入:

实体列表(Entities)

id,entity,description
5,VERDANT OASIS PLAZA,Verdant Oasis Plaza 是 Unity 游行的地点
6,HARMONY ASSEMBLY,Harmony Assembly 是在 Verdant Oasis Plaza 举办游行的组织

关系列表(Relationships)

id,source,target,description
37,VERDANT OASIS PLAZA,UNITY MARCH,Verdant Oasis Plaza 是 Unity 游行的举行地点
38,VERDANT OASIS PLAZA,HARMONY ASSEMBLY,Harmony Assembly 正在 Verdant Oasis Plaza 举办游行
39,VERDANT OASIS PLAZA,UNITY MARCH,Unity 游行正在 Verdant Oasis Plaza 举行
40,VERDANT OASIS PLAZA,TRIBUNE SPOTLIGHT,Tribune Spotlight 正在报道发生在 Verdant Oasis Plaza 的 Unity 游行
41,VERDANT OASIS PLAZA,BAILEY ASADI,Bailey Asadi 正在 Verdant Oasis Plaza 就游行发表演讲
43,HARMONY ASSEMBLY,UNITY MARCH,Harmony Assembly 是 Unity 游行的组织者

输出:

{{
"title": "Verdant Oasis Plaza 与 Unity 游行",
"summary": "该社区围绕 Verdant Oasis Plaza 展开,该地点是 Unity 游行的举行地。该广场与 Harmony Assembly、Unity 游行以及 Tribune Spotlight 等实体有着密切联系,均与此次游行活动有关。",
"rating": 5.0,
"rating_explanation": "由于 Unity 游行期间可能发生骚乱或冲突,因此社区影响评分为中等。",
"findings": [
{{
"summary": "Verdant Oasis Plaza 是社区核心地点",
"explanation": "Verdant Oasis Plaza 是该社区的核心实体,是 Unity 游行的举办地。它是连接其他所有实体的关键节点,显示了其在社区中的重要性。由于该广场与游行活动相关联,可能会引发公众秩序问题或冲突,具体影响视游行的性质及公众反应而定。[数据来源: Entities (5), Relationships (37, 38, 39, 40, 41, +more)]"
}},
{{
"summary": "Harmony Assembly 在社区中的角色",
"explanation": "Harmony Assembly 是该社区中的关键实体,负责在 Verdant Oasis Plaza 举办此次游行。其组织动机和游行性质可能成为风险因素,需重点关注该组织的背景和诉求。[数据来源: Entities(6), Relationships (38, 43)]"
}},
{{
"summary": "Unity 游行是一项关键事件",
"explanation": "Unity 游行是发生在 Verdant Oasis Plaza 的重要事件,是社区动态的关键因素。根据游行的目标和社会反应,该事件可能对公共安全造成影响。[数据来源: Relationships (39)]"
}},
{{
"summary": "媒体 Tribune Spotlight 的参与",
"explanation": "媒体 Tribune Spotlight 正在报道 Unity 游行,表明该事件已引发外界关注。这种媒体参与可能放大事件对社区和公众认知的影响。[数据来源: Relationships (40)]"
}}
]
}}

---真实数据---

请使用以下文本作为输入内容撰写报告。在输出中不得编造任何信息。

输入:

{input_text}

……报告结构与溯源规则同上……

输出:
E.3 社区问题回答生成(Community Answer Generation)
英文版
---Role---
You are a helpful assistant responding to questions about a dataset by synthesizing perspectives from multiple analysts.

---Goal---
Generate a response of the target length and format that responds to the user’s question, summarize all the reports from multiple analysts who focused on different parts of the dataset, and incorporate any relevant general knowledge.
Note that the analysts’ reports provided below are ranked in the \*\*descending order of helpfulness\*\*.
If you don’t know the answer, just say so. Do not make anything up.
The final response should remove all irrelevant information from the analysts’ reports and merge the cleaned information into a comprehensive answer that provides explanations of all the key points and implications appropriate for the response length and format.
Add sections and commentary to the response as appropriate for the length and format. Style the response in markdown.
The response shall preserve the original meaning and use of modal verbs such as "shall", "may" or "will".
The response should also preserve all the data references previously included in the analysts’ reports, but do not mention the roles of multiple analysts in the analysis process.
Do not list more than 5 record ids in a single reference. Instead, list the top 5 most relevant record ids and add "+more" to indicate that there are more.

For example:
"Person X is the owner of Company Y and subject to many allegations of wrongdoing [Data: Reports (2, 7, 34, 46, 64, +more)]. He is also CEO of company X [Data: Reports (1, 3)]"
where 1, 2, 3, 7, 34, 46, and 64 represent the id (not the index) of the relevant data record.
Do not include information where the supporting evidence for it is not provided.

---Target response length and format---
{response_type}

---Analyst Reports---
{report_data}

…Goal and Target response length and format repeated…
Add sections and commentary to the response as appropriate for the length and format. Style the response in markdown.
Output:
中文版
---角色---
你是一位乐于助人的助手,负责根据多个分析师对数据集的分析结果来回答用户的问题。

---目标---
生成符合目标长度和格式的回答,回应用户的问题,总结所有分析师对数据集中不同部分的分析内容,并结合相关通用知识。
请注意,下面提供的分析师报告是按**有用性从高到低**的顺序排列的。
如果你不知道答案,请直接说明。不允许编造内容。
最终的回答应剔除分析师报告中的所有无关信息,并将清洗后的信息整合为一份全面的回答,提供对所有关键点和含义的解释,并适合指定的长度和格式。
可根据回答的长度和格式添加章节和评论,使用 Markdown 风格撰写。
回答应保留原文中的情态动词(如 "shall"、"may"、"will")的原意和使用方式。
同时应保留分析师报告中引用的数据记录编号,但不要提及分析过程或分析师的角色。
单次引用的数据记录编号不得超过 5 条,应列出最相关的前 5 条记录编号,并添加 "+more" 表示还有更多相关数据。

示例:
"Person X 是 Company Y 的所有者,并且涉及多项不当行为指控 [数据来源: 报告 (2, 7, 34, 46, 64, +more)]。他还是公司 X 的首席执行官 [数据来源: 报告 (1, 3)]"
其中 1、2、3、7、34、46 和 64 是相关数据记录的编号(不是索引)。
不得包含没有提供支持证据的信息。

---目标回答长度与格式---
{response_type}

---分析师报告---
{report_data}

...Goal and Target response length and format repeated...

可根据回答的长度和格式添加章节和评论,使用 Markdown 风格撰写。
输出:
E.4 全局问题回答生成(Global Answer Generation)
英文版
---Role---
You are a helpful assistant responding to questions about data in the tables provided.

---Goal---
Generate a response of the target length and format that responds to the user’s question, summarize all relevant information in the input data tables appropriate for the response length and format, and incorporate any relevant general knowledge.
If you don’t know the answer, just say so. Do not make anything up.
The response shall preserve the original meaning and use of modal verbs such as "shall", "may" or "will".
Points supported by data should list the relevant reports as references as follows:
"This is an example sentence supported by data references [Data: Reports (report ids)]"
Note: the prompts for SS (semantic search) and TS (text summarization) conditions use ”Sources” in place of ”Reports” above.
Do not list more than 5 record ids in a single reference. Instead, list the top 5 most relevant record ids and add "+more" to indicate that there are more.
For example:
"Person X is the owner of Company Y and subject to many allegations of wrongdoing [Data: Reports (2, 7, 64, 46, 34, +more)]. He is also CEO of company X [Data: Reports (1, 3)]"
where 1, 2, 3, 7, 34, 46, and 64 represent the id (not the index) of the relevant data report in the provided tables.
Do not include information where the supporting evidence for it is not provided.
At the beginning of your response, generate an integer score between 0-100 that indicates how \*\*helpful\*\* is this response in answering the user’s question. Return the score in this format: <ANSWER_HELPFULNESS> score_value </ANSWER_HELPFULNESS>.

---Target response length and format---

{response_type}

---Data tables---

{context_data}

...Goal and Target response length and format repeated...

Output:
中文版
---角色---
你是一个有帮助的助手,负责根据提供的表格数据回答问题。

---目标---
生成一个符合目标长度和格式的回答,能回应用户的问题,概括输入数据表中所有相关信息,并结合任何相关的通用知识。
如果你不知道答案,就直接说明。不要编造任何内容。
回答应保留原始语义中“shall”、“may”或“will”等情态动词的使用。
支持的观点应列出相关报告作为数据参考,格式如下:
“这是一个由数据支持的示例句子 [数据:报告 (报告编号)]”
注意:对于语义搜索(SS)和文本摘要(TS)条件,使用“来源(Sources)”代替“报告(Reports)”。
在一个参考中不应列出超过5个记录编号。请列出最相关的前5个记录编号,并加上“+more”来表示还有更多记录。例如:
“X先生是Y公司的所有者,并且面临多项不当行为指控 [数据:报告 (2, 7, 64, 46, 34, +more)]。他还是X公司的首席执行官 [数据:报告 (1, 3)]”
其中 1, 2, 3, 7, 34, 46 和 64 是提供的数据报告的编号(不是索引)。
不要包括没有支持证据的信息。
在回答开头,生成一个 0-100 之间的整数分数,用于表示这个回答在解答用户问题方面的**帮助程度**,返回格式如下:<ANSWER_HELPFULNESS> 分数值 </ANSWER_HELPFULNESS>。

---目标回答长度和格式---

{response_type}

---数据表格---

{context_data}

...目标和目标回答长度与格式重复...

输出:
Appendix F Evaluation Prompts
F.1 Relative Assessment Prompt
---Role---

You are a helpful assistant responsible for grading two answers to a question that are provided by two different people.

---Goal---

Given a question and two answers (Answer 1 and Answer 2), assess which answer is better according to the following measure:

{criteria}

Your assessment should include two parts:
- Winner: either 1 (if Answer 1 is better) and 2 (if Answer 2 is better) or 0 if they are fundamentally similar and the differences are immaterial.
- Reasoning: a short explanation of why you chose the winner with respect to the measure described above.

Format your response as a JSON object with the following structure:
{{
"winner": <1, 2, or 0>,
"reasoning": "Answer 1 is better because <your reasoning>."
}}

---Question---

{question}

---Answer 1---

{answer1}

---Answer 2---

{answer2}

Assess which answer is better according to the following measure:

{criteria}

Output:
F.2 Relative Assessment Metrics
评分标准-英文
CRITERIA = {

"comprehensiveness": "How much detail does the answer provide to cover all the aspects and details of the question? A comprehensive answer should be thorough and complete, without being redundant or irrelevant. For example, if the question is ’What are the benefits and drawbacks of nuclear energy?’, a comprehensive answer would provide both the positive and negative aspects of nuclear energy, such as its efficiency, environmental impact, safety, cost, etc. A comprehensive answer should not leave out any important points or provide irrelevant information. For example, an incomplete answer would only provide the benefits of nuclear energy without describing the drawbacks, or a redundant answer would repeat the same information multiple times.",

"diversity": "How varied and rich is the answer in providing different perspectives and insights on the question? A diverse answer should be multi-faceted and multi-dimensional, offering different viewpoints and angles on the question. For example, if the question is ’What are the causes and effects of climate change?’, a diverse answer would provide different causes and effects of climate change, such as greenhouse gas emissions, deforestation, natural disasters, biodiversity loss, etc. A diverse answer should also provide different sources and evidence to support the answer. For example, a single-source answer would only cite one source or evidence, or a biased answer would only provide one perspective or opinion.",

"directness": "How specifically and clearly does the answer address the question? A direct answer should provide a clear and concise answer to the question. For example, if the question is ’What is the capital of France?’, a direct answer would be ’Paris’. A direct answer should not provide any irrelevant or unnecessary information that does not answer the question. For example, an indirect answer would be ’The capital of France is located on the river Seine’.",

"empowerment": "How well does the answer help the reader understand and make informed judgements about the topic without being misled or making fallacious assumptions. Evaluate each answer on the quality of answer as it relates to clearly explaining and providing reasoning and sources behind the claims in the answer."

}
评分标准-中文
* **全面性(comprehensiveness):**
  回答在多大程度上详尽地覆盖了问题的所有方面和细节?一个全面的答案应当是深入而完整的,同时不冗余也不偏题。
  例如,如果问题是“核能的优缺点是什么?”,那么一个全面的答案应当同时提供核能的积极和消极方面,例如其效率、环境影响、安全性、成本等。
  一个不全面的答案可能只描述了核能的好处而忽略了缺点,或者反复陈述相同内容而显得冗余。

* **多样性(diversity):**
  回答在提供不同观点和洞见方面有多丰富?一个多样性的答案应具有多角度和多维度,能从不同视角和层面探讨问题。
  例如,如果问题是“气候变化的原因和影响是什么?”,一个具有多样性的答案应包括多种原因和影响,如温室气体排放、森林砍伐、自然灾害、生物多样性丧失等。
  此外,还应引用多样的来源和证据加以支持。
  一个缺乏多样性的答案可能仅引用一个来源,或者只提供单一的观点。

* **直接性(directness):**
  回答有多明确、具体地回应了问题?一个直接的答案应清晰简明地回答核心问题。
  例如,如果问题是“法国的首都是哪里?”,那么直接的答案应是“巴黎”。
  一个间接的答案可能会说“法国的首都位于塞纳河畔”,这虽然没错,但未直接正面回答问题。

* **启发性(empowerment):**
  回答是否有助于读者理解问题,并据此作出明智判断,同时避免误导或不合理假设?
  请根据答案是否清晰解释观点、是否提供推理和数据来源等方面来评估其质量。
  一个具有启发性的答案能帮助读者建立正确认知,基于合理证据和逻辑自行判断,而非盲目接受结论。
Appendix G Statistical Analysis
本文节选自附录G,主要介绍了一项统计分析方法和结果。研究者在125个问题和两个数据集上对六个不同条件进行了四类指标(全面性、多样性、赋权性、直接性)的比较分析。
统计方法:
评分机制:
对每道题和每个指标,胜出条件得100分,败出得0分,平局各得50分。
所有得分在五个评估运行中取平均值。
分布检验:
数据不服从正态分布(Shapiro-Wilk检验结果),因此采用非参数统计方法——Wilcoxon符号秩检验比较条件对之间的差异。
多重比较校正:
为了控制多重比较带来的误差,使用了Holm-Bonferroni校正,显著性差异结果以加粗p值标出。
主要结果总结:
全面性 (Comprehensiveness):
在“Podcast Transcripts”和“News Articles”两个数据集中,SS (可能是某种摘要生成方法) 表现显著优于TS和C0-C3。
在Podcast Transcripts中,C2和C3得分均高于C0-C1,但在News Articles中,C2和C3的表现高于C1,但略低于C0。
TS在两个数据集中的表现均低于SS,且差异显著。
多样性 (Diversity):
SS 在两个数据集中的多样性表现显著优于TS和所有C组。
在Podcast Transcripts中,C3、C2表现优于C0和C1。
在News Articles中,C3和C2的表现显著优于C0和C1。
赋权性 (Empowerment):
SS在两个数据集中均显著优于TS和C0-C3。
TS在Podcast Transcripts中表现优于C0-C1,但在News Articles中,TS优于C0-C2,但与C3无显著差异。
C1和C3在News Articles中表现优于C0。
直接性 (Directness):
在两个数据集中,SS均显著优于TS和C0-C3。
TS在Podcast Transcripts中表现优于C0-C2,但在News Articles中,TS优于C2和C3。
在两个数据集中,C0通常表现最差,而C1和C2表现接近,C3表现略优于C0-C2。
总体趋势:
SS (可能是某种摘要生成方式) 在所有四个指标中都显著优于其他条件(TS和C0-C3)。
TS (可能是另一种生成方式) 在Podcast Transcripts中的表现优于C0-C2,但在News Articles中表现不如SS和C3。
C0-C3 的性能差异较小,但在大多数情况下,C2和C3的表现优于C0和C1。
重要结论:
这项统计分析表明,SS在全面性、多样性、赋权性和直接性四个维度上均表现最优,而TS在Podcast Transcripts中表现良好,但在News Articles中表现较差。对于C0-C3,C2和C3通常表现更好,但差异没有SS与TS之间的显著。