2.9. overfitting&underfitting
过拟合&欠拟合(Overfitting & Underfitting):
Learning how to deal with overfitting is essential to mastering machine learning.

The fundamental issue in machine learning is the tension between ``optimization`` and ``generalization``.
    Optimization refers to the process of adjusting a model
        to get the best performance possible on the training data.
    Generalization refers to how well the trained model performs on data it has never seen before.

The processing of fighting overfitting this way is called ``regularization``:
The most common regularization techniques:
    1. Get more training data.
        The best solution is to get more training data.
    2. Reducing the network’s size
        Always keep this in mind: deep-learning models tend to be good at fitting to the training data,
            but the real challenge is generalization, not fitting.
        Keep in mind that you should use models that have enough parameters that they don’t underfit:
            your model shouldn’t be starved for memorization resources.
    3. Adding weight regularization
        L1 regularization:
            The cost added is proportional to the absolute value of the weight coefficients(权重系数)
        L2 regularization:
            The cost added is proportional to the square of the value of the weight coefficients
            Also called weight decay(权重衰减)

        from keras import regularizers
        regularizers.l1(0.001)                  # L1 regularization
        regularizers.l2(0.001)                  # L2 regularization
        regularizers.l1_l2(l1=0.001, l2=0.001)  # Simultaneous L1 and L2 regularization
    3. Adding dropout
        dropout rate: it’s usually set between 0.2 and 0.5.
2.9.1. 以决策树为例讲解
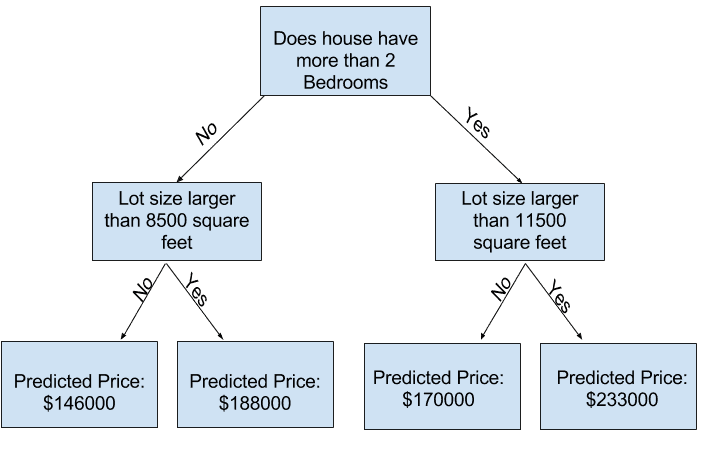
In practice, it’s not uncommon for a tree to have 10 splits between the top level (all houses) and a leaf. As the tree gets deeper, the dataset gets sliced up into leaves with fewer houses. If a tree only had 1 split, it divides the data into 2 groups. If each group is split again, we would get 4 groups of houses. Splitting each of those again would create 8 groups. If we keep doubling the number of groups by adding more splits at each level, we’ll have 210 groups of houses by the time we get to the 10th level. That’s 1024 leaves.
When we divide the houses amongst many leaves, we also have fewer houses in each leaf. Leaves with very few houses will make predictions that are quite close to those homes’ actual values, but they may make very unreliable predictions for new data (because each prediction is based on only a few houses).
This is a phenomenon called overfitting, where a model matches the training data almost perfectly, but does poorly in validation and other new data. On the flip side, if we make our tree very shallow, it doesn’t divide up the houses into very distinct groups.
At an extreme, if a tree divides houses into only 2 or 4, each group still has a wide variety of houses. Resulting predictions may be far off for most houses, even in the training data (and it will be bad in validation too for the same reason). When a model fails to capture important distinctions and patterns in the data, so it performs poorly even in training data, that is called underfitting.
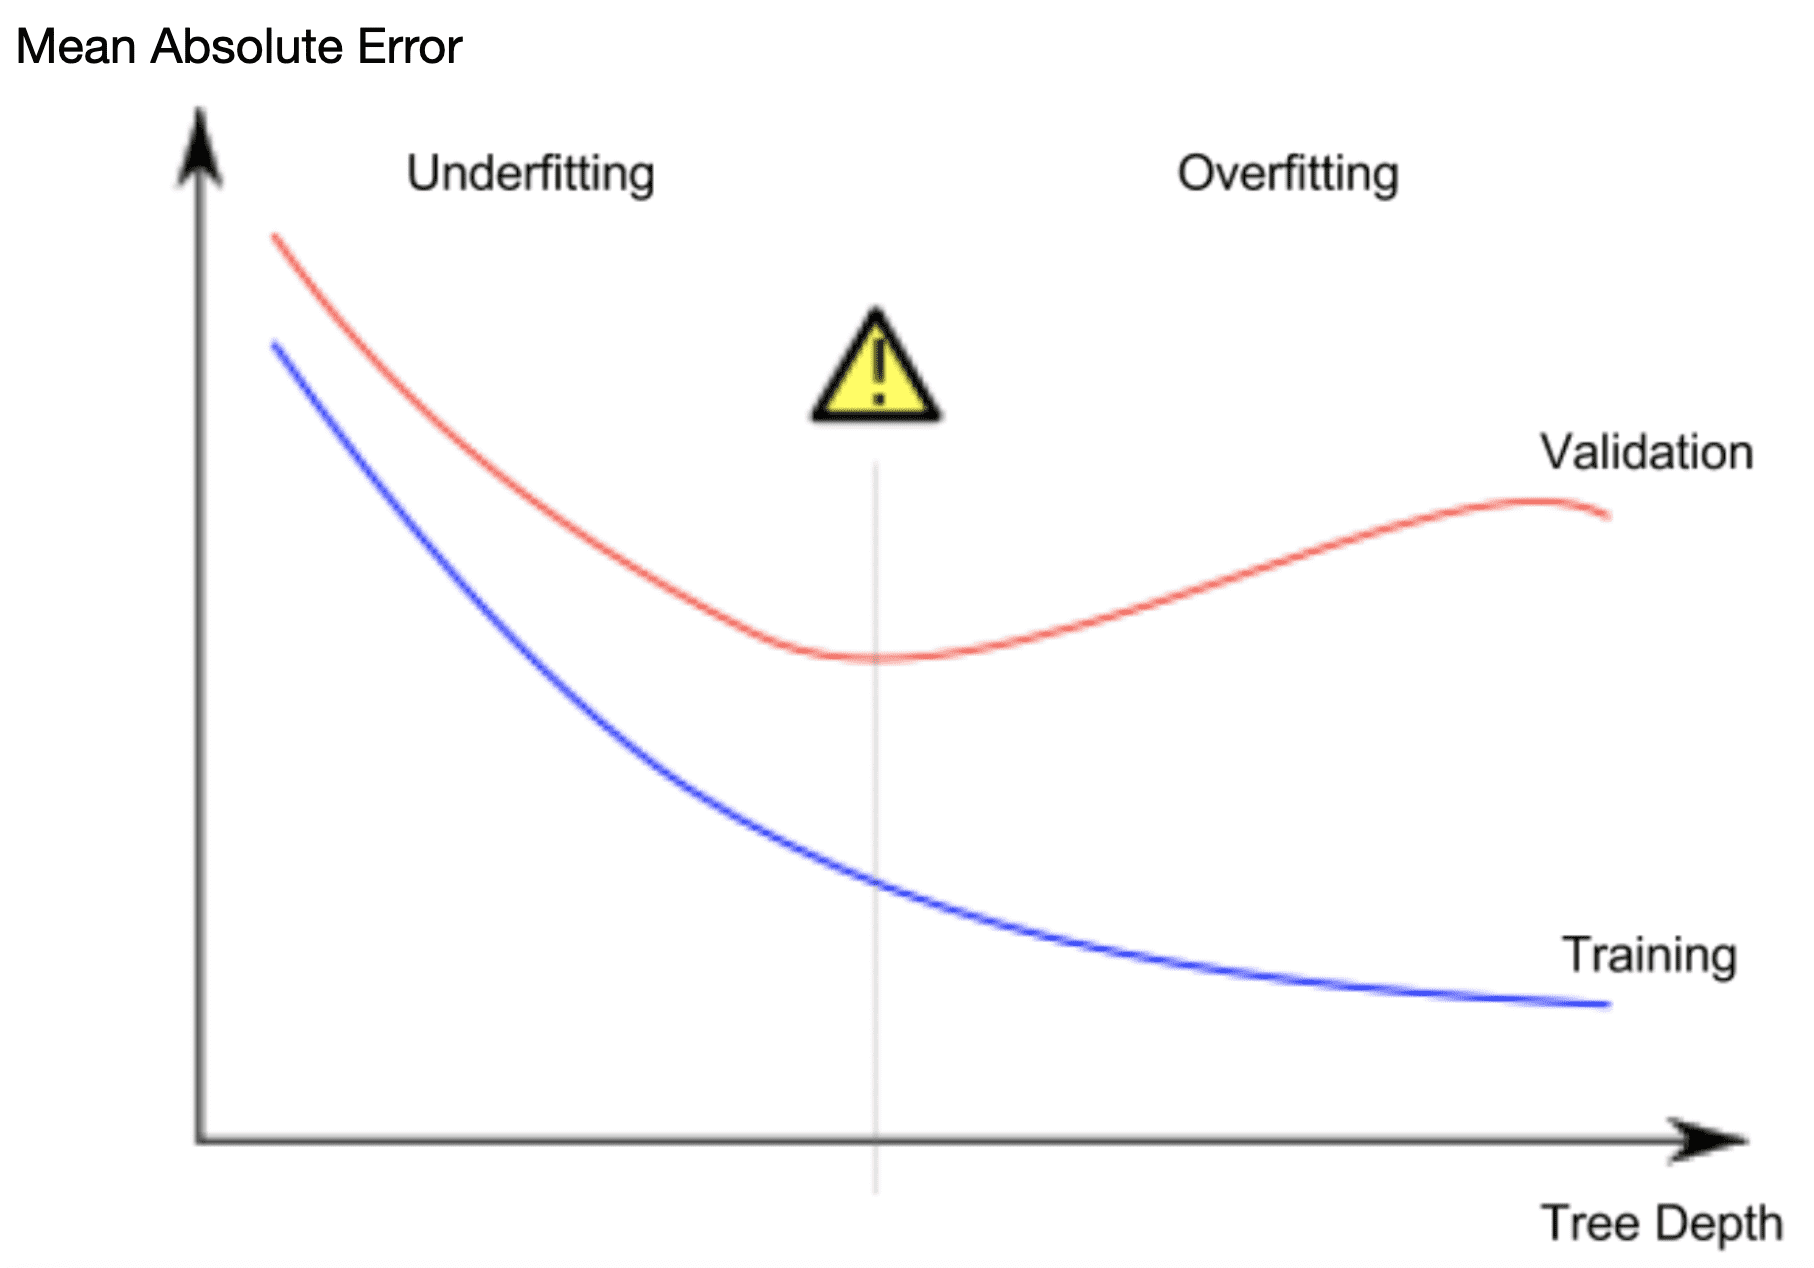
Since we care about accuracy on new data, which we estimate from our validation data, we want to find the sweet spot between underfitting and overfitting. Visually, we want the low point of the (red) validation curve in the figure below.
2.9.2. 参考
Underfitting and Overfitting: https://www.kaggle.com/code/dansbecker/underfitting-and-overfitting/tutorial