条形图bar
plt.bar()函数:
x,y参数:x,y值
width:宽度比例
facecolor柱状图里填充的颜色、edgecolor是边框的颜色
left-每个柱x轴左边界,bottom-每个柱y轴下边界 → bottom扩展即可化为甘特图 Gantt Chart
align:决定整个bar图分布,默认left表示默认从左边界开始绘制,center会将图绘制在中间位置
xerr/yerr :x/y方向error bar
示例
示例1-bar
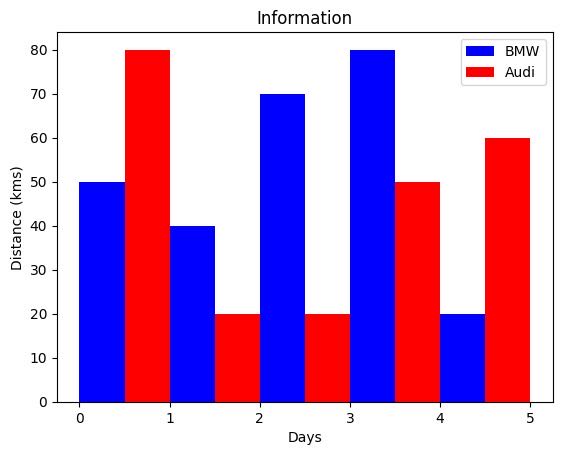
宝马和奥迪在5天内所覆盖的距离之间的比较:
from matplotlib import pyplot as plt
x = [0.25,1.25,2.25,3.25,4.25]
y = [50,40,70,80,20]
plt.bar(x, y, label="BMW", color='b', width=.5)     # 条形图

x2 = [.75,1.75,2.75,3.75,4.75]
y2 = [80,20,20,50,60]
plt.bar(x2, y2, label="Audi", color='r', width=.5)

plt.legend()

plt.xlabel('Days')
plt.ylabel('Distance (kms)')
plt.title('Information')
plt.show()
示例2-subplot多图
实例:
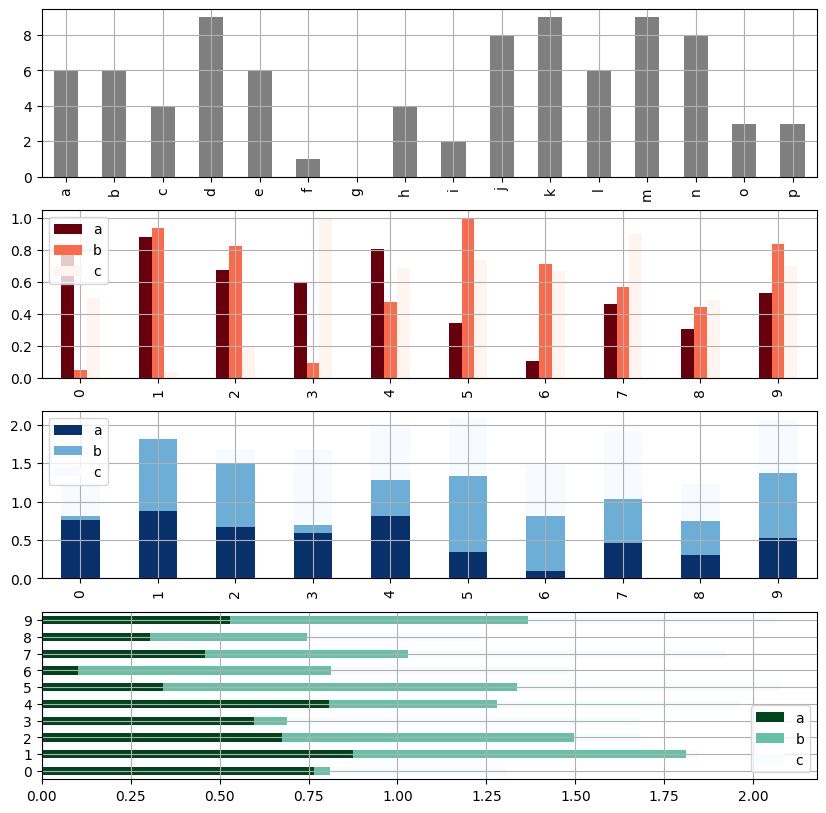
# 创建一个新的figure,并返回一个subplot对象的numpy数组
fig, axes = plt.subplots(4, 1, figsize = (10, 10))

# 单系列柱状图方法一: plt.plot(kind='bar/barh')
s = pd.Series(np.random.randint(0,10,16), index = list('abcdefghijklmnop'))
s.plot(kind='bar', color = 'k', grid = True, alpha = 0.5, ax = axes[0])  # ax参数 → 选择第几个子图

# 多系列柱状图
df = pd.DataFrame(np.random.rand(10,3), columns=['a','b','c'])
df.plot(kind='bar', ax = axes[1], grid = True, colormap='Reds_r')

# 多系列堆叠图
# stacked → 堆叠
df.plot(kind='bar', ax = axes[2], grid = True, colormap='Blues_r', stacked=True)

# The bars are positioned at y with the given align.
# Their dimensions are given by width and height.
# The horizontal baseline is left (default 0).
# https://matplotlib.org/api/_as_gen/matplotlib.pyplot.barh.html?highlight=barh#matplotlib.pyplot.barh
df.plot.barh(ax = axes[3],grid = True,stacked=True,colormap = 'BuGn_r')
示例3-误差条
实例:
plt.figure(figsize=(10,4))

x = np.arange(10)
y1 = np.random.rand(10)
plt.bar(x, y1, width = 1, facecolor = 'yellowgreen', edgecolor = 'white', yerr = y1*0.1)
for i, j in zip(x, y1):
    plt.text(i-0.2, j-0.15, '%.2f' % j, color = 'white')

y2 = -np.random.rand(10)
plt.bar(x, y2, width = 1, facecolor = 'lightskyblue', edgecolor = 'white', yerr = -y2*0.1)
for i, j in zip(x, y2):
    plt.text(i-0.2, j+0.05, '%.2f' % -j, color = 'white')
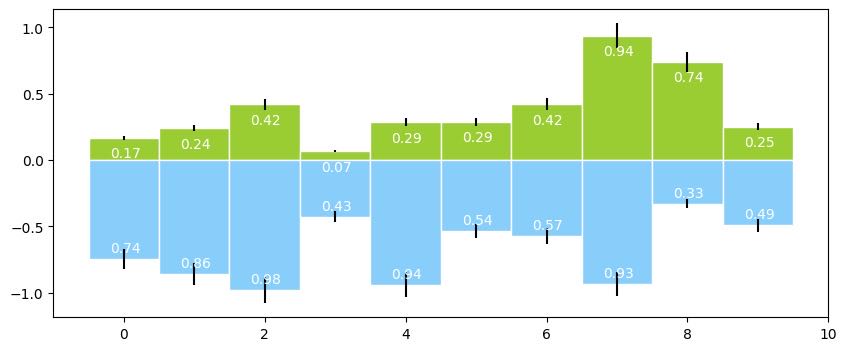
在 Matplotlib 中,yerr 参数用于指定误差条的值。它可以是以下类型之一:
1. 浮点数:所有数据点具有相同的对称误差
2. 一维数组:每个数据点具有一个对应的正负误差
3. (2, N) 数组:每个数据点具有一个对应的非对称误差。其中第一行包含负误差,第二行包含正误差
指定误差条的作用是显示数据的不确定性或准确性,表示数据点的真实值可能在误差条的范围内。例如,在科学研究中,通常会使用误差条来表示实验结果的不确定性。在商业分析中,通常会使用误差条来表示预测结果的不确定性。
重要
ValueError: ‘yerr’ must not contain negative values
以下是一些指定误差条的具体作用:
显示数据的准确性。误差条越长,数据的准确性越低。
比较不同数据集之间的差异。如果两个数据集的误差条重叠,则差异可能不显著。
识别异常值。如果某个数据点的误差条明显偏离其他数据点,则该数据点可能是异常值。