3.7.4. 报告
Trace 报告
源码:
// 生成追踪报告
func traceProfile() {
    f, err := os.OpenFile("trace.out", os.O_RDWR|os.O_CREATE, 0644)
    if err != nil {
        log.Fatal(err)
    }
    defer f.Close()

    log.Println("Trace started")
    trace.Start(f)
    defer trace.Stop()

    time.Sleep(60 * time.Second)
    fmt.Println("Trace stopped")
}
使用:
$ go tool trace xxxx
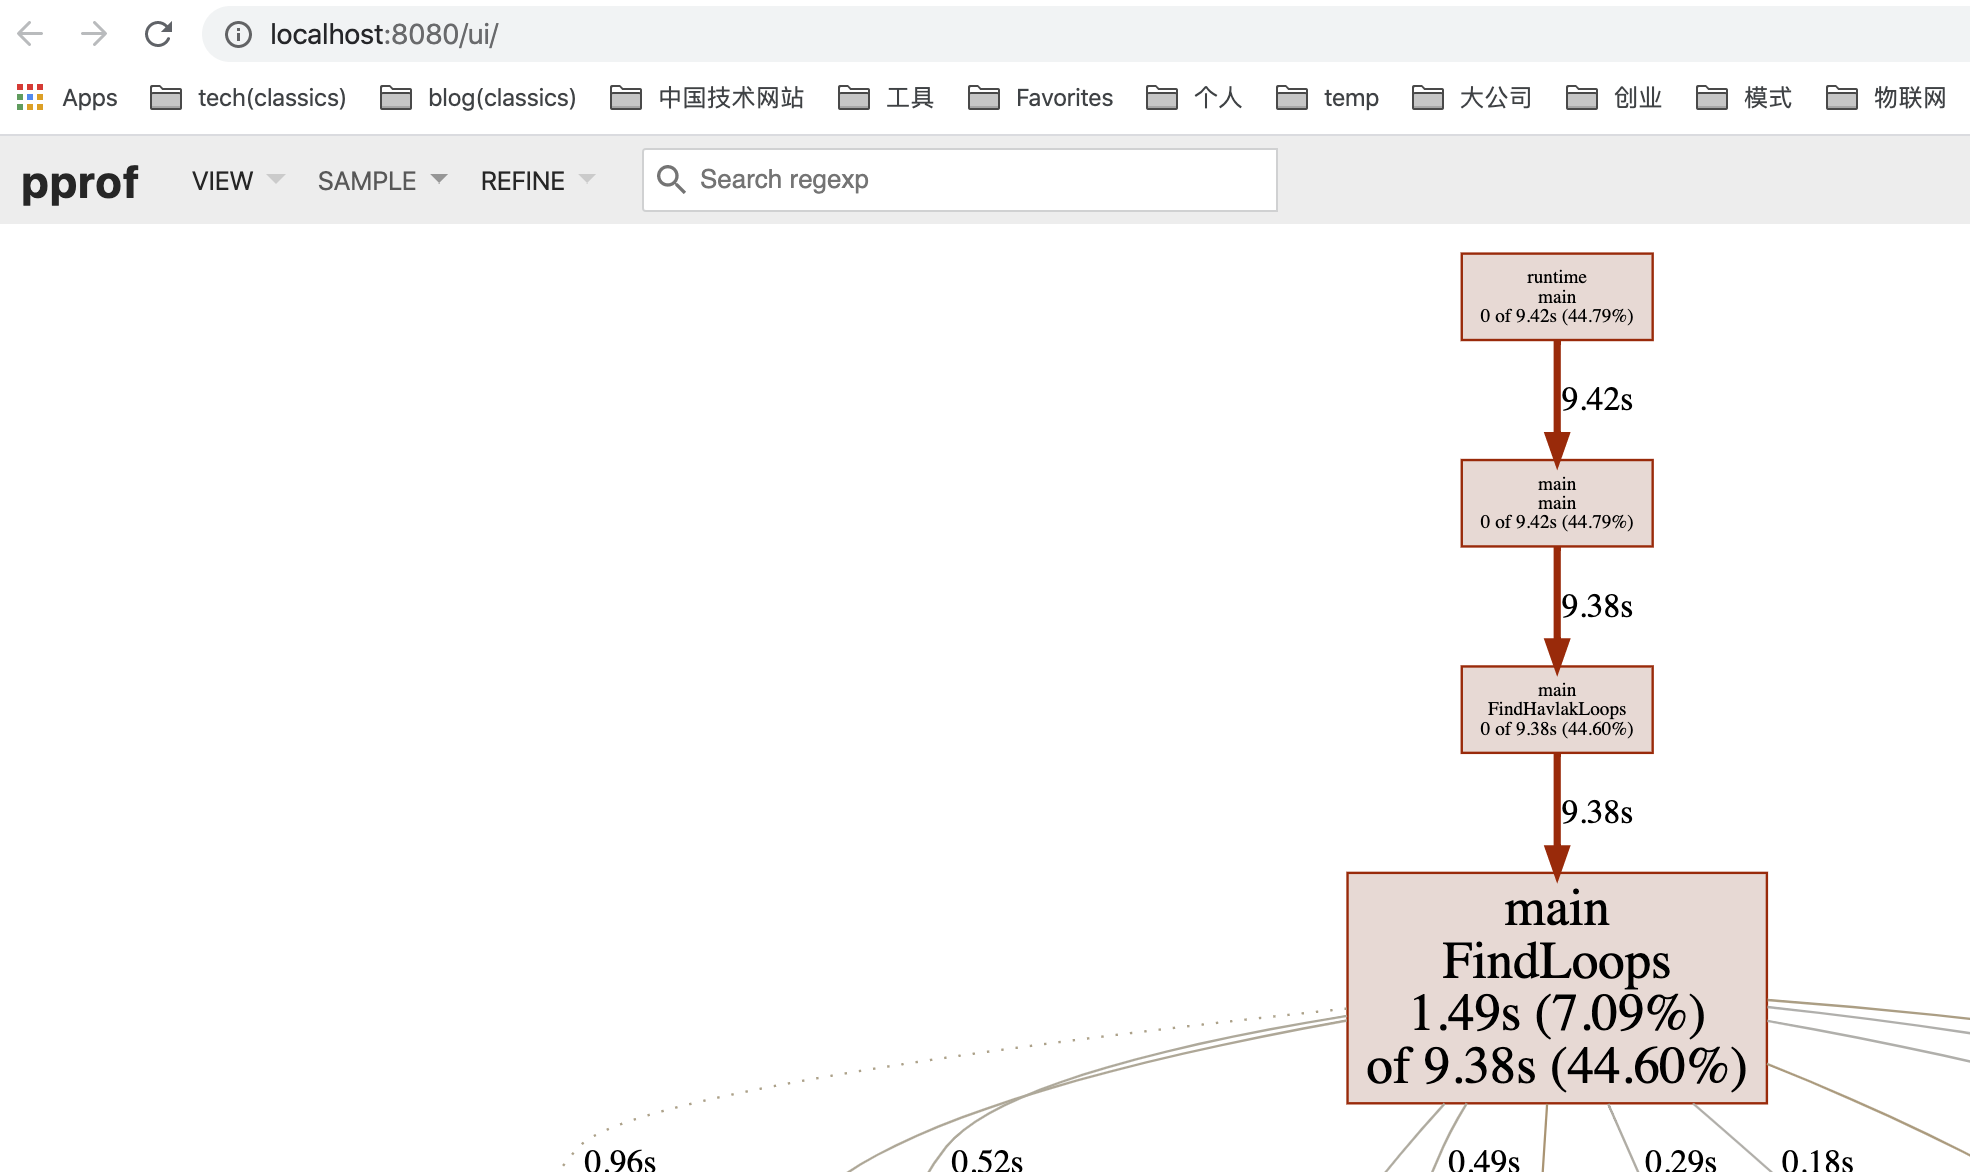
火焰图
$ go tool pprof -http=":8081" [binary] [profile]

实例:
$ go tool pprof -http=":8081" ./simple ./heap
$ go tool pprof -http=":8081" ./simple  http://localhost:6060/debug/pprof/heap
也可使用pprof命令:
// 生成pprof
$ go get -u github.com/google/pprof

// 使用
$ pprof -http=":8081" [binary] [profile]
在上面的压测过程中,我们再新建一个终端窗口输入以下命令,生成我们的profile文件:
// 我们设置了25秒的采样时间
$ go tool pprof --seconds 25 http://localhost:9090/debug/pprof/profile