mutexprofile
仍然用2.3中的代码,只需要改两个地方,将 runtime.SetBlockProfileRate(1 * 1000 * 1000) 改为:
// 当 rate = 0 时,关闭 mutex prof (默认值)
// 当 rate = 1 时,表示记录所有的 mutex event
// 当 rate > 1 时,记录 1/rate 的 mutex event(随机)
runtime.SetMutexProfileFraction(1)
再将writeProfTo(“block”, “block.bprof”)改为writeProfTo(“mutex”, “mutex.mprof”)编译运行,并打开 pprof 工具:
$ go tool pprof bin/Temp mutex.mprof
(pprof) top
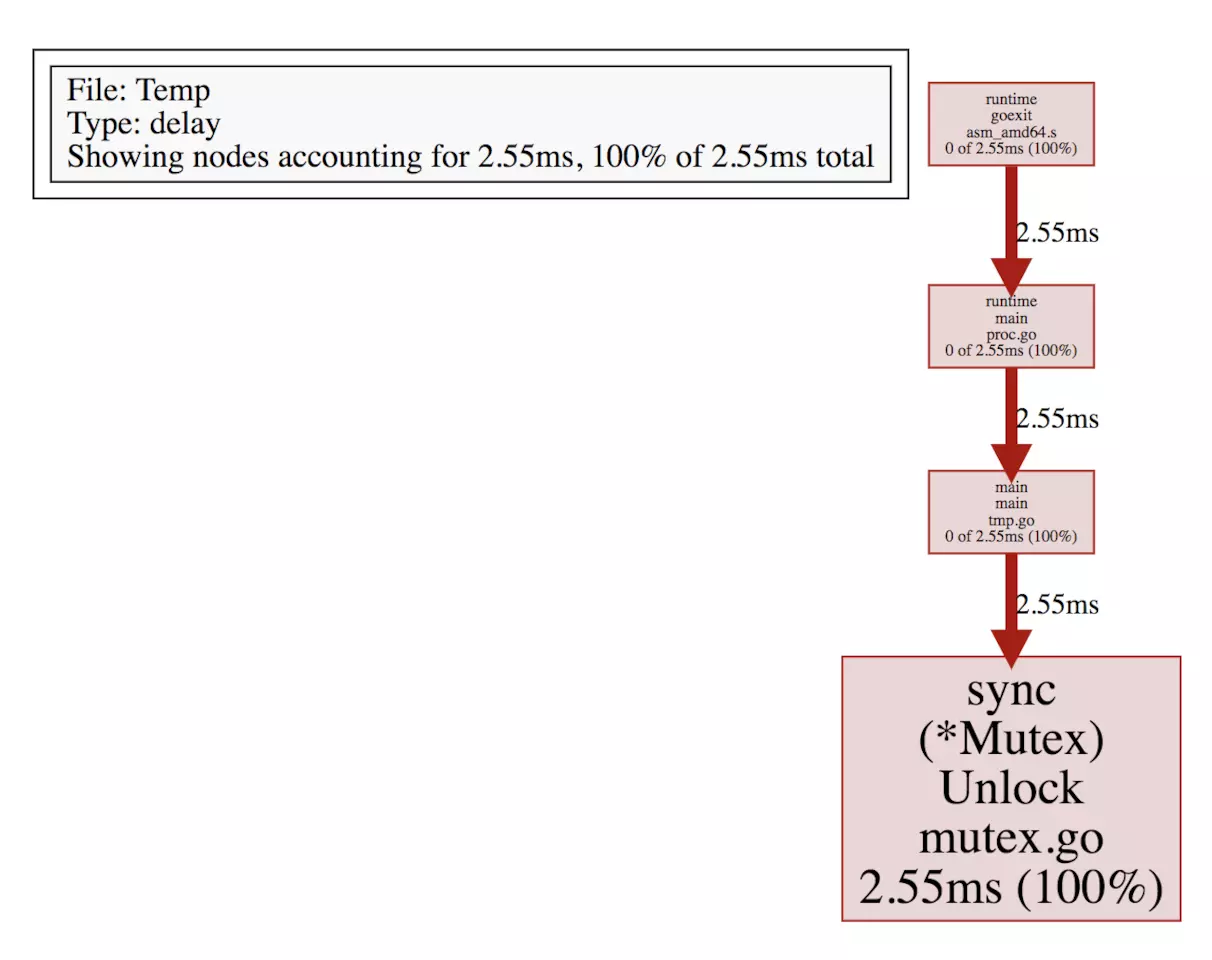
Showing nodes accounting for 2.55ms, 100% of 2.55ms total
flat flat% sum% cum cum%
2.55ms 100% 100% 2.55ms 100% sync.(*Mutex).Unlock /go/1.9.1/libexec/src/sync/mutex.go
0 0% 100% 2.55ms 100% main.main /go/src/ngs/test/tmp/tmp.go
0 0% 100% 2.55ms 100% runtime.goexit /go/1.9.1/libexec/src/runtime/asm_amd64.s
0 0% 100% 2.55ms 100% runtime.main /go/1.9.1/libexec/src/runtime/proc.go
查看 svg 图: