cpuprofile
以 Profiling Go Programs 中的 示例代码 为例:
$ go build -o havlak1 havlak1.go
$ ./havlak1 --cpuprofile=havlak1.prof
# of loops: 76000 (including 1 artificial root node)
$ go tool pprof havlak1 havlak1.prof
File: havlak1
Type: cpu
Time: Apr 3, 2018 at 3:50pm (CST)
Duration: 20.40s, Total samples = 23.30s (114.24%)
Entering interactive mode (type "help" for commands, "o" for options)
(pprof)
查看cpu 消耗 top5:
(pprof) top5
Showing nodes accounting for 9.60s, 41.20% of 23.30s total
Dropped 112 nodes (cum <= 0.12s)
Showing top 5 nodes out of 90
  flat  flat%   sum%        cum   cum%
 2.59s 11.12% 11.12%      2.78s 11.93%  runtime.mapaccess1_fast64 /go/1.9.1/libexec/src/runtime/hashmap_fast.go
 2.26s  9.70% 20.82%      4.97s 21.33%  runtime.scanobject /go/1.9.1/libexec/src/runtime/mgcmark.go
 2.06s  8.84% 29.66%     13.79s 59.18%  main.FindLoops /Code/goprof/havlak/havlak1.go
 1.39s  5.97% 35.62%      1.39s  5.97%  runtime.heapBitsForObject /go/1.9.1/libexec/src/runtime/mbitmap.go
 1.30s  5.58% 41.20%      4.14s 17.77%  runtime.mapassign_fast64 /go/1.9.1/libexec/src/runtime/hashmap_fast.go
top5用于显示消耗 CPU 前五的函数,每一行代表一个函数,每一列为一项指标:
flat:
    采样时,该函数正在运行的次数*采样频率(10ms),即得到估算的函数运行”采样时间”。这里不包括函数等待子函数返回。
flat%:
    flat / 总采样时间值
sum%:
    前面所有行的 flat% 的累加值,如第二行 sum% = 20.82% = 11.12% + 9.70%
cum:
    采样时,该函数出现在调用堆栈的采样时间,包括函数等待子函数返回。因此 flat <= cum
cum%:
    cum / 总采样时间值
go tool pprof 常用命令:
topN:
    输入 top 命令,默认显示 flat 前10的函数调用,可使用 -cum 以 cum 排序
list Func:
    显示函数名以及每行代码的采样分析
web:
    生成 svg 热点图片,可在浏览器中打开,可使用 web Func 来过滤指定函数相关调用树
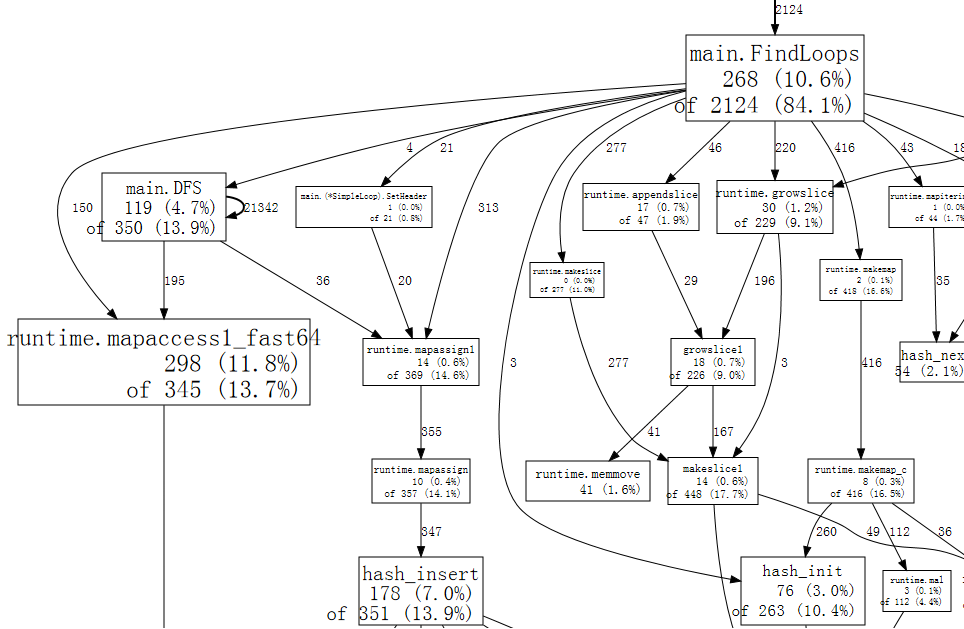
通过top5命令可以看到,mapaccess1_fast64函数占用的CPU 采样时间最多,通过 web mapaccess1_fast64 命令打开调用图谱,查看该函数调用关系,可以看到主要在DFS 和 FindLoops 中调用的,然后再通过 list DFS查看函数代码和关键调用,得到 map 结构是瓶颈点,尝试转换为 slice 优化,整个过程参考 Profiling Go Programs 。总的思路就是通过top 和web 找出关键函数,再通过list Func 查看函数代码,找到关键代码行并确认优化方案(辅以 go test Benchmark)。