blockprofile
pprof_blockprofile.go内容:
package main

import (
    "fmt"
    "os"
    "runtime"
    "runtime/pprof"
    "sync"
    "time"
)

var mutex sync.Mutex
func main() {
    // rate = 1 时, 统计所有的 block event,
    // rate <=0 时,则关闭block profiling
    // rate > 1 时,为 ns 数,阻塞时间t>rate的event 一定会被统计,小于rate则有t/rate 的几率被统计
    // 参考 https://github.com/golang/go/blob/release-branch.go1.9/src/runtime/mprof.go#L397
    runtime.SetBlockProfileRate(1 * 1000 * 1000)
    var wg sync.WaitGroup
    wg.Add(1)
    mutex.Lock()
    go worker(&wg)
    time.Sleep(2*time.Millisecond)
    mutex.Unlock()
    wg.Wait()
    writeProfTo("block", "block.bprof")
}

func worker(wg *sync.WaitGroup) {
    defer wg.Done()
    mutex.Lock()
    time.Sleep(1*time.Millisecond)
    mutex.Unlock()
}

func writeProfTo(name, fn string) {
    p := pprof.Lookup(name)
    if p == nil {
      fmt.Errorf("%s prof not found", name)
      return
    }
    f, err := os.Create(fn)
    if err != nil {
      fmt.Errorf("%v", err.Error())
      return
    }
    defer f.Close()
    err = p.WriteTo(f, 0)
    if err != nil {
      fmt.Errorf("%v", err.Error())
      return
    }
}
运行程序并 pprof:
▶ go build -o blockprofile pprof_blockprofile.go
▶ go tool pprof blockprofile block.bprof
(pprof) top
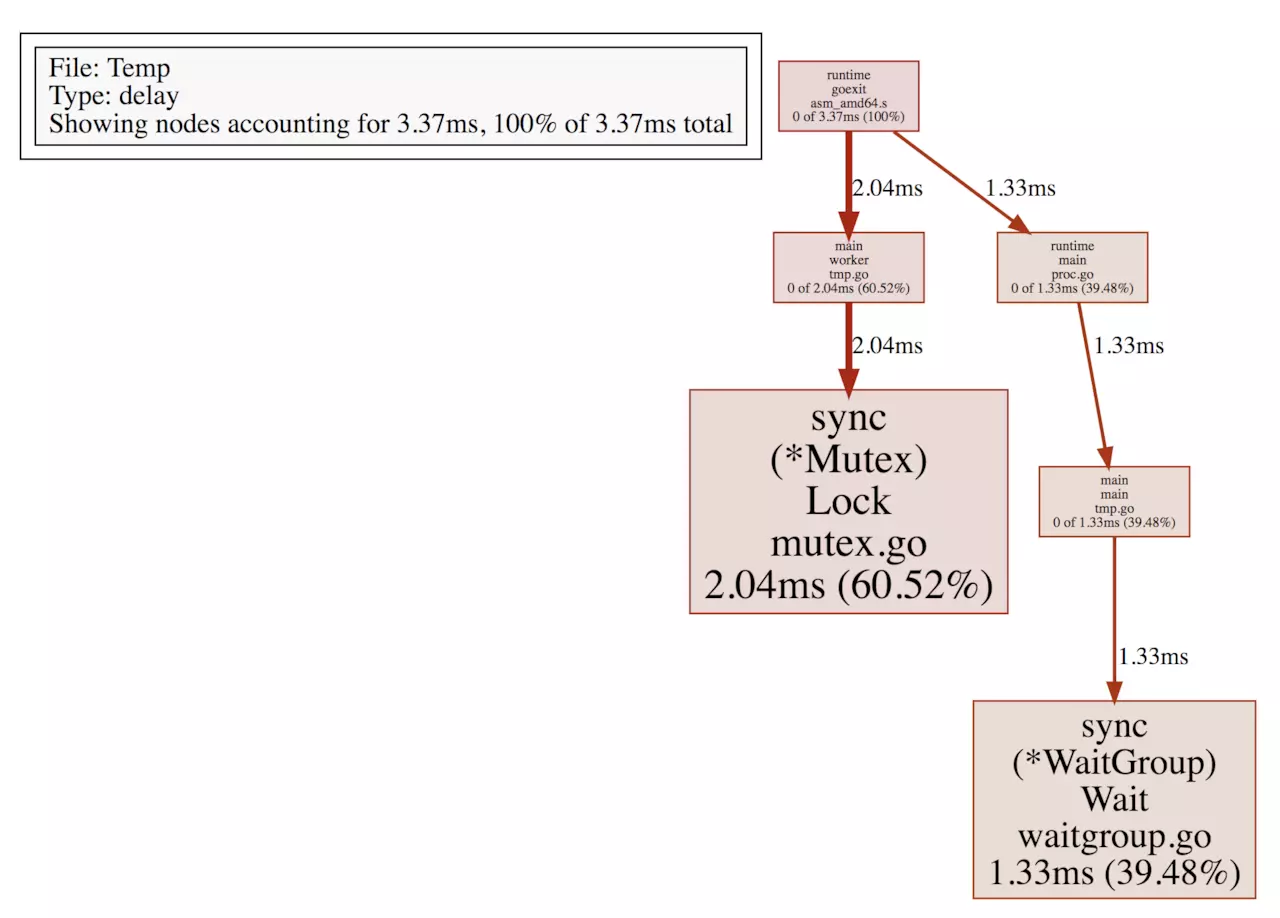
Showing nodes accounting for 3.37ms, 100% of 3.37ms total
flat flat% sum% cum cum%
2.04ms 60.52% 60.52% 2.04ms 60.52% sync.(*Mutex).Lock /go/1.9.1/libexec/src/sync/mutex.go
1.33ms 39.48% 100% 1.33ms 39.48% sync.(*WaitGroup).Wait /go/1.9.1/libexec/src/sync/waitgroup.go
0 0% 100% 1.33ms 39.48% main.main /go/src/ngs/test/tmp/tmp.go
0 0% 100% 2.04ms 60.52% main.worker /go/src/ngs/test/tmp/tmp.go
0 0% 100% 3.37ms 100% runtime.goexit /go/1.9.1/libexec/src/runtime/asm_amd64.s
0 0% 100% 1.33ms 39.48% runtime.main /go/1.9.1/libexec/src/runtime/proc.go
可以看到程序在 mutex.Lock 上阻塞了2.04ms(worker goroutine), 在 WaitGroup.Wait 上等待了1.33ms(main goroutine),从更上层来看,在 main 函数中一共阻塞了2.04ms,worker函数中阻塞了1.33ms(cum 列),通过 web命令生成 svg 图片在浏览器查看: