Webmachine调试
基本用法
修改
init/1方法:init(Config) -> {{trace, "/tmp"}, Config}. %% debugging code %%{ok, Config}. %% regular code
重新编译并载入这个模块, 然后执行如下方法:
wmtrace_resource:add_dispatch_rule("wmtrace", "/tmp").
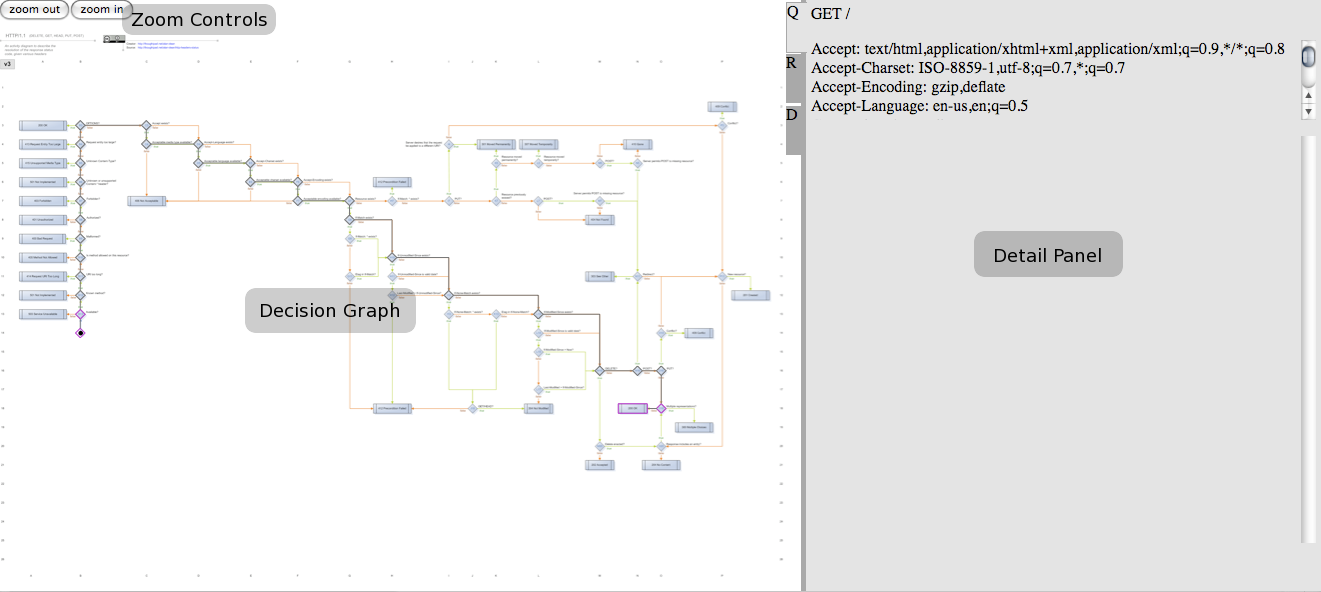
在浏览器中输入 http://YOUR_HOST/wmtrace/ 你就会得到如下图所示:
配置文件细节
生产配置跟踪日志
注意: 跟踪日志文件可以很大,所以不要在生产环境中使用
全路径:
init(Config) ->
   {{trace, "/tmp/traces"}, Config}. %% absolute path /tmp/traces
相对路径:
init(Config) ->
   {{trace, "traces"}, Config}. %% "traces" directory in application's root
跟踪日志察看器配置
察看器可以通过
dispatch list进行配置, 也可以使用如下两个方法可以修改:wmtrace_resource:add_dispatch_rule/2 or wmtrace_resource:remove_dispatch_rules/0
方法
add_dispatch_rule/2带有两个参数——the HTTP-exported path和the path to the trace files,如:wmtrace_resource:add_dispatch_rule("dev/wmtrace", "/tmp/traces"). % 在地址http://YOUR_HOST/dev/wmtrace/显示查看器 % 日志文件所在目录为 /tmp/traces
如果你想让你的日志查看器一直可用,可以在application’s dispatch list中进行配置:
{["dev", "wmtrace", '*'], wmtrace_resource, [{trace_dir, "/tmp/traces"}]}
To disable all trace viewer resources at any point:
wmtrace_resource:remove_dispatch_rules/0
跟踪日志格式
如果你不想通过日志查看器进行查看,想直接读日志文件,它的格式如下:
{decision, X}.
 indicates that a decision point was reached

{attempt, Module, Function, Args}.
 indicates that a call to Module:Function(Args) was made.

{result, Module, Function, Result}.
 indicates that the call to Module:Function(Args) returned Result .

{not_expored, Module, Function, Args}.
 indicates that Module:Function(Args) would have been called, but it was not exported (or not defined) by the module
这种格式的代码可以通过方法 file:consult/1 得到一系列的erlang terms.